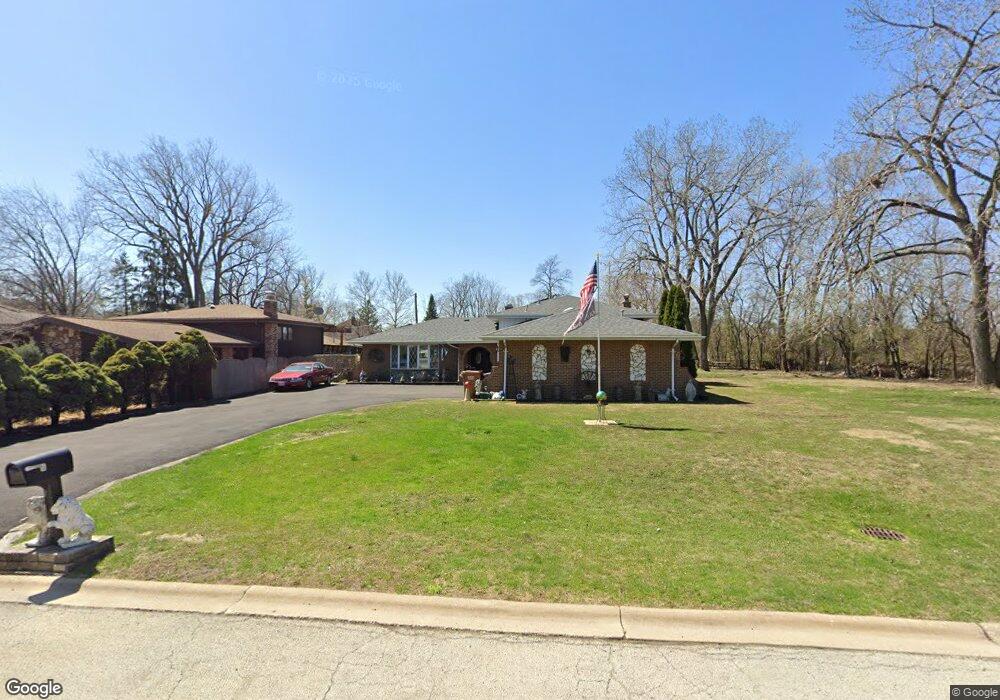
213 N Nolton Ave Willow Springs, IL 60480
Estimated Value: $376,817 - $465,000
3
Beds
3
Baths
1,547
Sq Ft
$264/Sq Ft
Est. Value
About This Home
This home is located at 213 N Nolton Ave, Willow Springs, IL 60480 and is currently estimated at $407,954, approximately $263 per square foot. 213 N Nolton Ave is a home located in Cook County with nearby schools including Willow Springs Elementary School, Argo Community High School, and Trinity Lutheran School.
Ownership History
Date
Name
Owned For
Owner Type
Purchase Details
Closed on
Sep 30, 2015
Sold by
Marquette Bank
Bought by
Zeitz Richard R and Ahern Debbie C
Current Estimated Value
Home Financials for this Owner
Home Financials are based on the most recent Mortgage that was taken out on this home.
Original Mortgage
$213,750
Outstanding Balance
$168,858
Interest Rate
4%
Mortgage Type
New Conventional
Estimated Equity
$239,096
Purchase Details
Closed on
Feb 26, 2014
Sold by
Przybylski Jack V
Bought by
Marquette Bank and Trust #20271
Purchase Details
Closed on
Mar 7, 2005
Sold by
Przybylski Josephine
Bought by
Przybylski Josephine and Przybylski Jack V
Purchase Details
Closed on
Nov 25, 1997
Sold by
Przybylski Jack
Bought by
Przybylski Josephine
Purchase Details
Closed on
Feb 10, 1994
Sold by
Hamer Michael J and Hamer Anita
Bought by
Pryzybylski Jack and Przybylski Josephine
Create a Home Valuation Report for This Property
The Home Valuation Report is an in-depth analysis detailing your home's value as well as a comparison with similar homes in the area
Home Values in the Area
Average Home Value in this Area
Purchase History
| Date | Buyer | Sale Price | Title Company |
|---|---|---|---|
| Zeitz Richard R | $225,000 | None Available | |
| Marquette Bank | $160,000 | None Available | |
| Przybylski Josephine | -- | -- | |
| Przybylski Josephine | -- | -- | |
| Pryzybylski Jack | $111,666 | -- |
Source: Public Records
Mortgage History
| Date | Status | Borrower | Loan Amount |
|---|---|---|---|
| Open | Zeitz Richard R | $213,750 |
Source: Public Records
Tax History Compared to Growth
Tax History
| Year | Tax Paid | Tax Assessment Tax Assessment Total Assessment is a certain percentage of the fair market value that is determined by local assessors to be the total taxable value of land and additions on the property. | Land | Improvement |
|---|---|---|---|---|
| 2024 | $7,790 | $32,000 | $6,971 | $25,029 |
| 2023 | $5,935 | $32,000 | $6,971 | $25,029 |
| 2022 | $5,935 | $22,178 | $6,062 | $16,116 |
| 2021 | $5,703 | $22,177 | $6,062 | $16,115 |
| 2020 | $5,163 | $22,177 | $6,062 | $16,115 |
| 2019 | $5,974 | $27,113 | $5,455 | $21,658 |
| 2018 | $5,796 | $27,113 | $5,455 | $21,658 |
| 2017 | $6,754 | $27,113 | $5,455 | $21,658 |
| 2016 | $7,535 | $22,438 | $4,849 | $17,589 |
| 2015 | $7,258 | $22,438 | $4,849 | $17,589 |
| 2014 | $7,884 | $22,438 | $4,849 | $17,589 |
| 2013 | $8,639 | $26,679 | $4,849 | $21,830 |
Source: Public Records
Map
Nearby Homes
- 8395 Archer Ave
- 8420 Archer Ave
- 8422 Archer Ave
- 106 Kazwell St
- 815 Vinewood Ave
- 8473 Archer Ave Unit 204
- 133 Rachel Ave Unit 501D
- 506 S Charleton St
- 8832 Rust St Unit 3
- 8832 Rust St Unit 1
- 8832 Rust St Unit 2
- Douglas Plan at Willow Springs Town Center
- 8611 Archer Ave
- 5 Cliffside Dr Unit 5
- 400 Village Cir Unit 109
- 400 Village Cir Unit 102
- 300 Village Cir Unit 203
- 300 Village Cir Unit 207
- 8764 Archer Ave
- 1048 Testa Dr
- 211 N Nolton Ave
- 205 N Nolton Ave
- 210 N Charleton St
- 203 N Nolton Ave
- 214 N Nolton Ave
- 216 N Nolton Ave
- 210 N Nolton Ave
- 210 N Nolton Ave
- 204 N Charleton St
- 208 N Nolton Ave
- 201 N Nolton Ave
- 206 N Nolton Ave
- 200 N Charleton St
- 204 N Nolton Ave
- 204 N Nolton Ave
- 200 N Nolton Ave
- 200 N Nolton Ave
- 113 N Nolton Ave
- 211 Spring St
- 209 Spring St