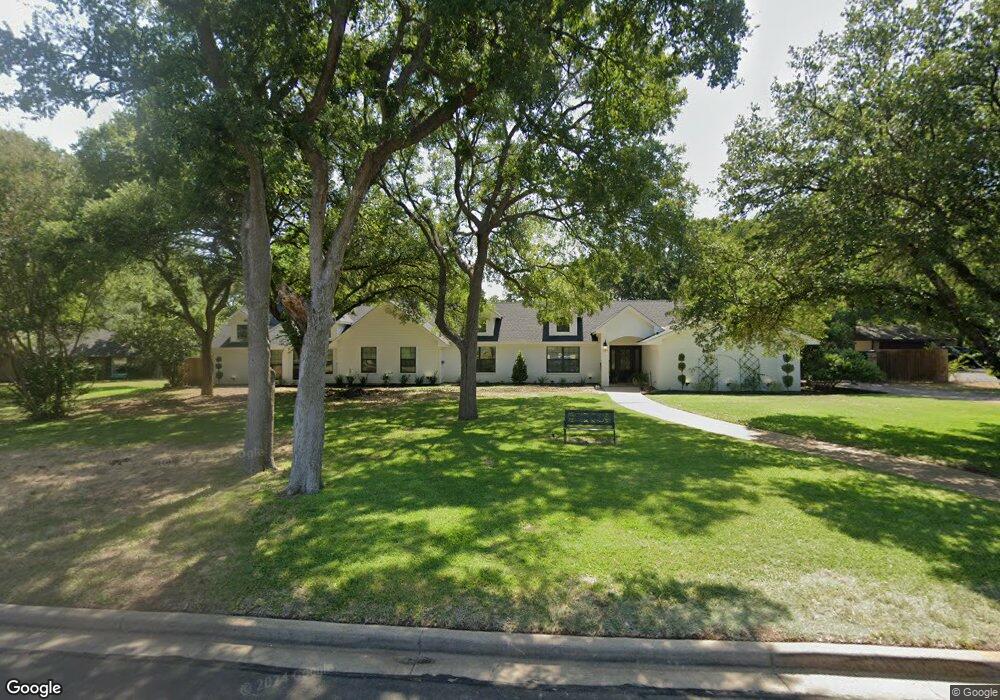
213 Oak Creek Cir Mc Gregor, TX 76657
Estimated Value: $713,000 - $758,000
5
Beds
4
Baths
3,807
Sq Ft
$191/Sq Ft
Est. Value
About This Home
This home is located at 213 Oak Creek Cir, Mc Gregor, TX 76657 and is currently estimated at $726,421, approximately $190 per square foot. 213 Oak Creek Cir is a home located in McLennan County with nearby schools including South Bosque Elementary School, River Valley Middle School, and Midway High School.
Ownership History
Date
Name
Owned For
Owner Type
Purchase Details
Closed on
Jun 23, 2016
Sold by
Alexander Mark Steven
Bought by
Woods Riley D and Woods Rachel C
Current Estimated Value
Home Financials for this Owner
Home Financials are based on the most recent Mortgage that was taken out on this home.
Original Mortgage
$390,000
Outstanding Balance
$310,397
Interest Rate
3.57%
Mortgage Type
VA
Estimated Equity
$416,024
Purchase Details
Closed on
Jul 17, 2014
Sold by
Flennigan Lisa Gail and Alexander Lisa Gayle
Bought by
Alexander Mark Steven
Purchase Details
Closed on
Jan 26, 2006
Sold by
Bereck James L and Bereck Bonnie M
Bought by
Alexander Cecil Dell
Home Financials for this Owner
Home Financials are based on the most recent Mortgage that was taken out on this home.
Original Mortgage
$188,575
Interest Rate
6.22%
Mortgage Type
Purchase Money Mortgage
Create a Home Valuation Report for This Property
The Home Valuation Report is an in-depth analysis detailing your home's value as well as a comparison with similar homes in the area
Home Values in the Area
Average Home Value in this Area
Purchase History
| Date | Buyer | Sale Price | Title Company |
|---|---|---|---|
| Woods Riley D | -- | None Available | |
| Alexander Mark Steven | -- | None Available | |
| Alexander Cecil Dell | -- | First American Title |
Source: Public Records
Mortgage History
| Date | Status | Borrower | Loan Amount |
|---|---|---|---|
| Open | Woods Riley D | $390,000 | |
| Previous Owner | Alexander Cecil Dell | $188,575 |
Source: Public Records
Tax History Compared to Growth
Tax History
| Year | Tax Paid | Tax Assessment Tax Assessment Total Assessment is a certain percentage of the fair market value that is determined by local assessors to be the total taxable value of land and additions on the property. | Land | Improvement |
|---|---|---|---|---|
| 2025 | -- | $665,633 | -- | -- |
| 2024 | $12,972 | $605,121 | $0 | $0 |
| 2023 | $11,841 | $550,110 | $75,350 | $474,760 |
| 2022 | $12,347 | $514,432 | $0 | $0 |
| 2021 | $12,305 | $477,450 | $59,840 | $417,610 |
| 2020 | $11,306 | $425,150 | $55,410 | $369,740 |
| 2019 | $11,163 | $409,020 | $53,190 | $355,830 |
| 2018 | $11,363 | $412,920 | $52,080 | $360,840 |
| 2017 | $10,656 | $384,630 | $48,760 | $335,870 |
| 2016 | $8,670 | $312,950 | $47,960 | $264,990 |
| 2015 | $7,478 | $302,830 | $47,960 | $254,870 |
| 2014 | $7,478 | $299,070 | $46,850 | $252,220 |
Source: Public Records
Map
Nearby Homes
- 306 Winding Creek Ln
- 319 Winding Creek Ln
- 343 Stone Creek Cir
- 518 Stone Canyon Dr
- 313 Stone Manor Dr
- 211 Desert Sky Dr
- 203 Silver Spur Trail
- 114 Stone Creek Ranch Rd
- 248 Woodhaven Trail
- 403 Silver Spur Trail
- 230 Oak Meadow Trail
- 509 Sagebrush Ln
- 113 Oak Meadow Trail
- 904 Glorietta Dr
- 312 Champions Way
- 100 Victors Cir
- 213 Amistad Cir
- Wycliff Plan at Church Road Estates
- 28368 U S 84
- Trenton Plan at Sunwest Village
- 211 Oak Creek Cir
- 215 Oak Creek Cir
- 208 Oak Creek Cir
- 210 Oak Creek Cir
- 217 Oak Creek Cir
- 209 Oak Creek Cir
- 212 Oak Creek Cir
- 206 Oak Creek Cir
- 219 Oak Creek Cir
- 216 Oak Creek Cir
- 218 Oak Creek Cir
- 207 Oak Creek Cir
- 214 Oak Creek Cir
- 220 Oak Creek Cir
- 221 Oak Creek Cir
- 204 Oak Creek Cir
- 205 Oak Creek Cir
- 222 Oak Creek Cir
- 231 Oak Creek Cir
- 229 Oak Creek Cir