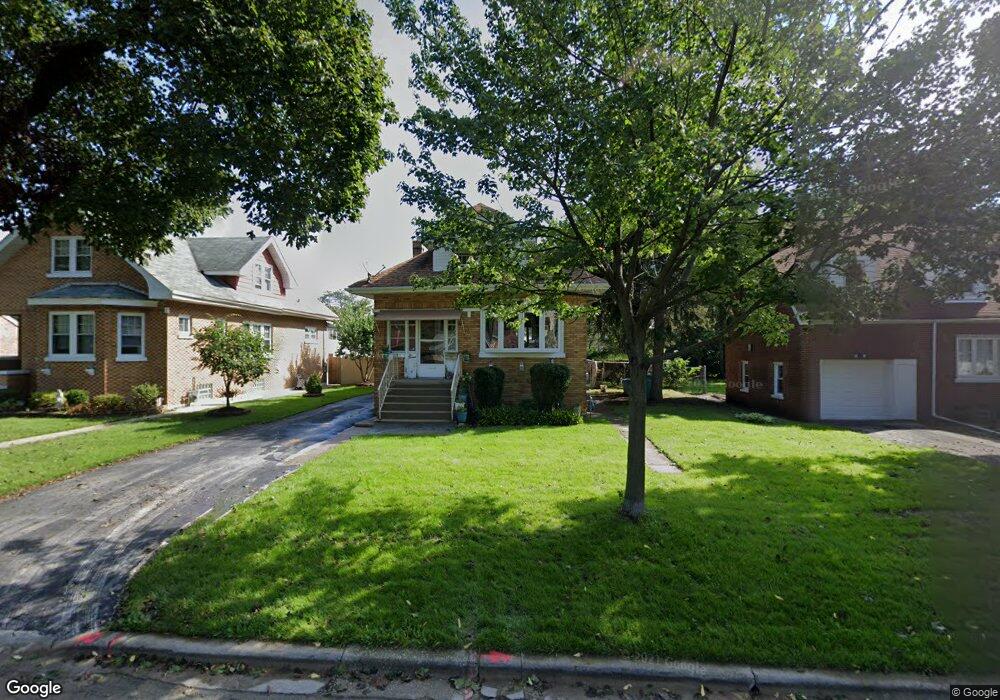
213 Orchard St Hillside, IL 60162
Estimated Value: $307,748 - $369,000
4
Beds
1
Bath
1,340
Sq Ft
$257/Sq Ft
Est. Value
About This Home
This home is located at 213 Orchard St, Hillside, IL 60162 and is currently estimated at $344,937, approximately $257 per square foot. 213 Orchard St is a home located in Cook County with nearby schools including Hillside Elementary School and Proviso West High School.
Ownership History
Date
Name
Owned For
Owner Type
Purchase Details
Closed on
Sep 23, 2008
Sold by
Lopez Mario and Lopez Consuelo
Bought by
Lopez Mario and Lopez Consuelo
Current Estimated Value
Purchase Details
Closed on
Jan 30, 2004
Sold by
Lopez Mario and Molina Omar
Bought by
Lopez Mario
Purchase Details
Closed on
Aug 13, 1999
Sold by
Reaney Michael and Reaney Nancy
Bought by
Lopez Mario and Molina Omar
Home Financials for this Owner
Home Financials are based on the most recent Mortgage that was taken out on this home.
Original Mortgage
$146,023
Interest Rate
7.88%
Mortgage Type
FHA
Purchase Details
Closed on
May 18, 1995
Sold by
Golz Clarence C
Bought by
Reaney Michael and Reaney Nancy
Home Financials for this Owner
Home Financials are based on the most recent Mortgage that was taken out on this home.
Original Mortgage
$70,000
Interest Rate
8.26%
Create a Home Valuation Report for This Property
The Home Valuation Report is an in-depth analysis detailing your home's value as well as a comparison with similar homes in the area
Home Values in the Area
Average Home Value in this Area
Purchase History
| Date | Buyer | Sale Price | Title Company |
|---|---|---|---|
| Lopez Mario | -- | Chicago Title Insurance Co | |
| Lopez Mario | -- | First American Title Ins Co | |
| Lopez Mario | $147,000 | Professional National Title | |
| Reaney Michael | $102,000 | Attorneys Natl Title Network |
Source: Public Records
Mortgage History
| Date | Status | Borrower | Loan Amount |
|---|---|---|---|
| Previous Owner | Lopez Mario | $146,023 | |
| Previous Owner | Reaney Michael | $70,000 |
Source: Public Records
Tax History Compared to Growth
Tax History
| Year | Tax Paid | Tax Assessment Tax Assessment Total Assessment is a certain percentage of the fair market value that is determined by local assessors to be the total taxable value of land and additions on the property. | Land | Improvement |
|---|---|---|---|---|
| 2024 | $6,504 | $25,001 | $3,548 | $21,453 |
| 2023 | $4,455 | $25,001 | $3,548 | $21,453 |
| 2022 | $4,455 | $18,032 | $3,064 | $14,968 |
| 2021 | $4,426 | $18,031 | $3,063 | $14,968 |
| 2020 | $1,648 | $18,031 | $3,063 | $14,968 |
| 2019 | $4,264 | $17,354 | $2,741 | $14,613 |
| 2018 | $4,139 | $17,354 | $2,741 | $14,613 |
| 2017 | $6,185 | $17,354 | $2,741 | $14,613 |
| 2016 | $4,477 | $12,310 | $2,418 | $9,892 |
| 2015 | $2,750 | $12,310 | $2,418 | $9,892 |
| 2014 | $2,082 | $12,310 | $2,418 | $9,892 |
| 2013 | $2,860 | $13,627 | $2,418 | $11,209 |
Source: Public Records
Map
Nearby Homes
- 114 Oak Ridge Ave
- 134 S Maple Ave
- 1245 S Mannheim Rd Unit 2
- 1247 S Mannheim Rd Unit 3
- 10524 Camelot St
- 10531 Camelot St
- 1413 Highridge Pkwy
- 1242 Heidorn Ave
- 1326 Heidorn Ave
- 1327 S Wolf Rd
- 1318 Balmoral Ave
- 1128 Marshall Ave
- 10567 Waterford Dr
- 1244 Westchester Blvd
- 1136 Park Place
- 1215 Westchester Blvd
- 10301 Chaucer St
- 3901 Jackson St
- 3912 Adams St
- 335 Buckthorn Ln
- 209 Orchard St
- 217 Orchard St
- 217 Orchard Ave
- 205 Orchard St
- 221 Orchard St
- 221 Orchard Ave
- 214 Oak Ridge Ave
- 201 Orchard St
- 225 Orchard St
- 212 Oak Ridge Ave
- 218 Oak Ridge Ave
- 226 Oak Ridge Ave
- 226 Oak Ridge Ave
- 184 Oak Ridge Ave
- 218 Orchard St
- 218 Orchard St
- 159 Orchard St
- 210 Orchard St
- 229 Orchard St
- 229 Orchard Ave