213 Park Ave Belton, MO 64012
Belton AreaEstimated Value: $204,693 - $222,000
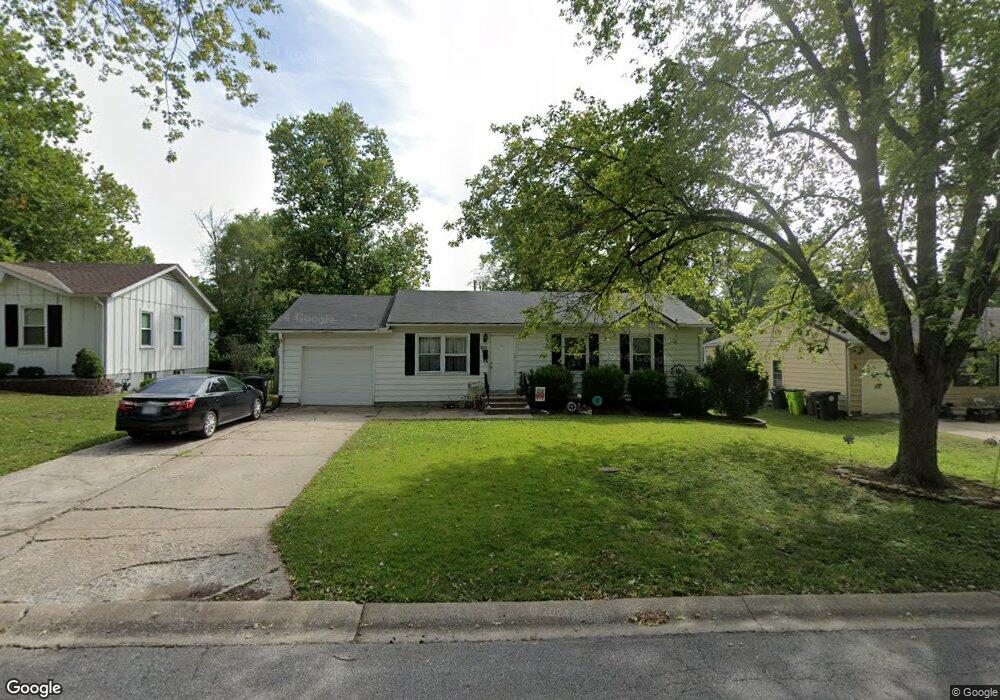
About This Home
This home is located at 213 Park Ave, Belton, MO 64012 and is currently estimated at $214,173, approximately $234 per square foot. 213 Park Ave is a home located in Cass County with nearby schools including Cambridge Elementary School, Belton Middle School, and Mill Creek Upper Elementary School.
Ownership History
We collect this data history from publicly available records. To have your information removed, we recommend requesting removal directly through your county’s website.
Purchase Details
Home Financials for this Owner
Home Financials are based on the most recent Mortgage that was taken out on this home.Purchase Details
Purchase Details
Home Financials for this Owner
Home Financials are based on the most recent Mortgage that was taken out on this home.Home Values in the Area
Average Home Value in this Area
Purchase History
We collect this data history from publicly available records. To have your information removed, we recommend requesting removal directly through your county’s website.
| Date | Buyer | Sale Price | Title Company |
|---|---|---|---|
| $85,000 | None Available | ||
| -- | -- | ||
| -- | None Available |
Mortgage History
We collect this data history from publicly available records. To have your information removed, we recommend requesting removal directly through your county’s website.
| Date | Status | Borrower | Loan Amount |
|---|---|---|---|
| Open | $95,542 | ||
| Previous Owner | $111,443 |
Tax History
We collect this data history from publicly available records. To have your information removed, we recommend requesting removal directly through your county’s website.
| Year | Tax Paid | Tax Assessment Tax Assessment Total Assessment is a certain percentage of the fair market value that is determined by local assessors to be the total taxable value of land and additions on the property. | Land | Improvement |
|---|---|---|---|---|
| 2025 | $1,599 | $22,020 | $1,950 | $20,070 |
| 2024 | $1,599 | $19,390 | $1,780 | $17,610 |
| 2023 | $1,595 | $19,390 | $1,780 | $17,610 |
| 2022 | $1,417 | $17,080 | $1,780 | $15,300 |
| 2021 | $1,417 | $17,080 | $1,780 | $15,300 |
| 2020 | $1,381 | $16,550 | $1,780 | $14,770 |
| 2019 | $1,353 | $16,550 | $1,780 | $14,770 |
| 2018 | $1,184 | $14,610 | $1,420 | $13,190 |
| 2017 | $1,030 | $14,610 | $1,420 | $13,190 |
| 2016 | $1,030 | $12,640 | $1,420 | $11,220 |
| 2015 | $1,030 | $12,640 | $1,420 | $11,220 |
| 2014 | $1,034 | $12,640 | $1,420 | $11,220 |
| 2013 | -- | $12,640 | $1,420 | $11,220 |
Map
- 205 Eldorado Dr
- 912 Ridge Dr
- 403 Park Ave
- 406 Timbercreek Dr
- 403 Timbercreek Dr
- 501 Park Ave
- 110 Brentwood Dr
- 107 Brentwood Dr
- 121 Brent Rd
- 914 Elm Ct
- 1106 S Scott Ave
- 306 Pacific Dr
- 118 Nanette St
- 1113 Kent Dr
- 704 S Cedar St
- 517 Buena Vista Dr
- 303 Crystal Dr
- 120 E South Ave
- 518 Madera Ct
- 821 Heather Dr
Ask me questions while you tour the home.