213 Pierce St Plymouth, IN 46563
Estimated Value: $173,000 - $192,000
3
Beds
2
Baths
1,352
Sq Ft
$137/Sq Ft
Est. Value
About This Home
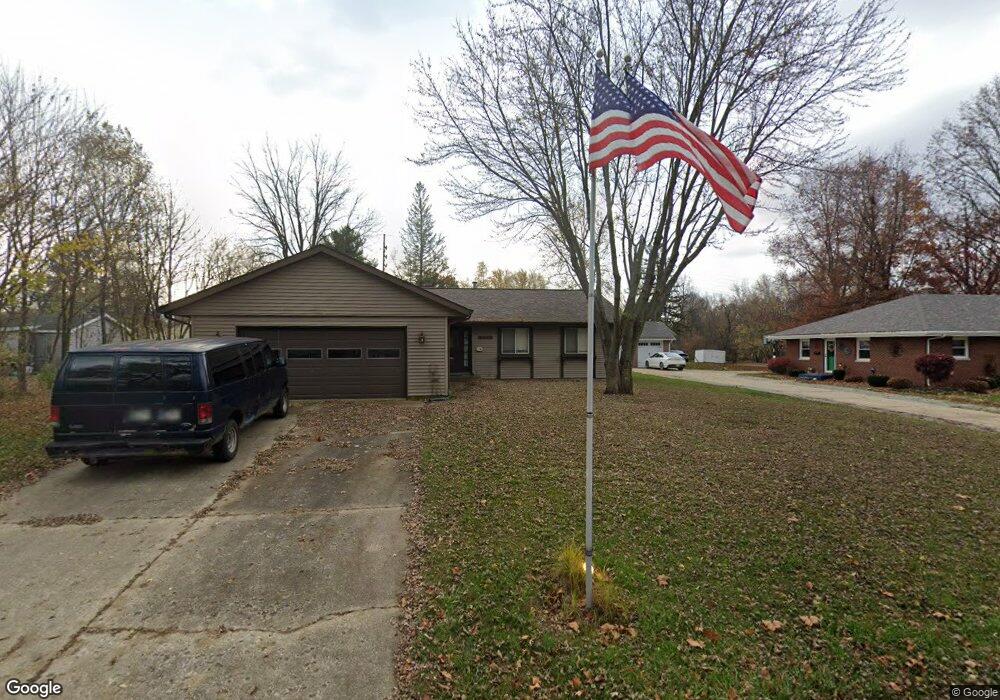
This home is located at 213 Pierce St, Plymouth, IN 46563 and is currently estimated at $185,387, approximately $137 per square foot. 213 Pierce St is a home located in Marshall County with nearby schools including Plymouth High School and House of the Lord Christian Acadamy.
Ownership History
Date
Name
Owned For
Owner Type
Purchase Details
Closed on
Oct 5, 2006
Sold by
Morcombe Robin C
Bought by
Morcombe Kris L and Morcombe Robin C
Current Estimated Value
Home Financials for this Owner
Home Financials are based on the most recent Mortgage that was taken out on this home.
Original Mortgage
$104,000
Outstanding Balance
$61,841
Interest Rate
6.49%
Mortgage Type
New Conventional
Estimated Equity
$123,546
Purchase Details
Closed on
Aug 19, 2002
Sold by
Carothers William R
Bought by
Carr Roland F and Carr Margaret P
Create a Home Valuation Report for This Property
The Home Valuation Report is an in-depth analysis detailing your home's value as well as a comparison with similar homes in the area
Home Values in the Area
Average Home Value in this Area
Purchase History
| Date | Buyer | Sale Price | Title Company |
|---|---|---|---|
| Morcombe Kris L | -- | None Available | |
| Carr Roland F | $94,000 | -- |
Source: Public Records
Mortgage History
| Date | Status | Borrower | Loan Amount |
|---|---|---|---|
| Open | Morcombe Kris L | $104,000 |
Source: Public Records
Tax History Compared to Growth
Tax History
| Year | Tax Paid | Tax Assessment Tax Assessment Total Assessment is a certain percentage of the fair market value that is determined by local assessors to be the total taxable value of land and additions on the property. | Land | Improvement |
|---|---|---|---|---|
| 2024 | $659 | $153,400 | $25,800 | $127,600 |
| 2022 | $666 | $141,100 | $23,800 | $117,300 |
| 2021 | $7 | $108,200 | $18,400 | $89,800 |
| 2020 | $7 | $103,400 | $17,100 | $86,300 |
| 2019 | $5 | $97,500 | $16,500 | $81,000 |
| 2018 | $5 | $89,200 | $10,300 | $78,900 |
| 2017 | $5 | $90,100 | $10,500 | $79,600 |
| 2016 | -- | $90,100 | $10,500 | $79,600 |
| 2014 | -- | $89,000 | $10,300 | $78,700 |
Source: Public Records
Map
Nearby Homes