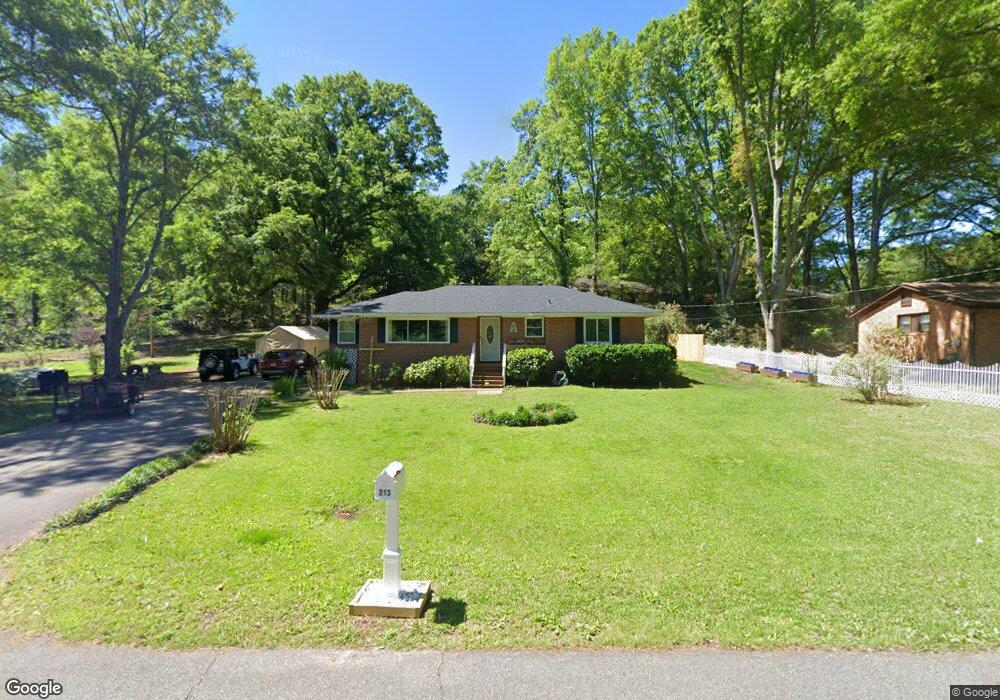
213 Pine St Barnesville, GA 30204
Estimated Value: $209,000 - $243,000
3
Beds
1
Bath
1,232
Sq Ft
$179/Sq Ft
Est. Value
About This Home
This home is located at 213 Pine St, Barnesville, GA 30204 and is currently estimated at $220,821, approximately $179 per square foot. 213 Pine St is a home located in Lamar County with nearby schools including Lamar County Primary School, Lamar County Elementary School, and Lamar County Middle School.
Ownership History
Date
Name
Owned For
Owner Type
Purchase Details
Closed on
Mar 1, 2022
Sold by
Waller Glenna Houk
Bought by
Abbott David Cooper and Abbott Marie Lou
Current Estimated Value
Purchase Details
Closed on
Nov 21, 2008
Sold by
United Bank
Bought by
Waller Larry D
Home Financials for this Owner
Home Financials are based on the most recent Mortgage that was taken out on this home.
Original Mortgage
$69,932
Interest Rate
6.01%
Mortgage Type
New Conventional
Purchase Details
Closed on
Sep 2, 2008
Sold by
Conger Dennis Y
Bought by
United Bank
Purchase Details
Closed on
Feb 22, 2007
Sold by
Conger Hugh Alan
Bought by
Conger Dennis
Purchase Details
Closed on
Apr 1, 1987
Sold by
Conger Hugh
Bought by
Conger Dennis Y
Create a Home Valuation Report for This Property
The Home Valuation Report is an in-depth analysis detailing your home's value as well as a comparison with similar homes in the area
Home Values in the Area
Average Home Value in this Area
Purchase History
| Date | Buyer | Sale Price | Title Company |
|---|---|---|---|
| Abbott David Cooper | -- | -- | |
| Waller Larry D | $65,000 | -- | |
| United Bank | -- | -- | |
| Conger Dennis | -- | -- | |
| Conger Dennis | -- | -- | |
| Conger Dennis Y | -- | -- |
Source: Public Records
Mortgage History
| Date | Status | Borrower | Loan Amount |
|---|---|---|---|
| Previous Owner | Waller Larry D | $69,932 |
Source: Public Records
Tax History Compared to Growth
Tax History
| Year | Tax Paid | Tax Assessment Tax Assessment Total Assessment is a certain percentage of the fair market value that is determined by local assessors to be the total taxable value of land and additions on the property. | Land | Improvement |
|---|---|---|---|---|
| 2024 | $1,653 | $59,363 | $7,489 | $51,874 |
| 2023 | $1,833 | $59,363 | $7,800 | $51,563 |
| 2022 | $1,251 | $45,302 | $7,800 | $37,502 |
| 2021 | $1,099 | $36,547 | $7,800 | $28,747 |
| 2020 | $1,028 | $32,476 | $7,800 | $24,676 |
| 2019 | $1,031 | $32,476 | $7,800 | $24,676 |
| 2018 | $809 | $26,550 | $7,800 | $18,750 |
| 2017 | $805 | $26,550 | $7,800 | $18,750 |
| 2016 | $805 | $26,550 | $7,800 | $18,750 |
| 2015 | $804 | $26,550 | $7,800 | $18,750 |
| 2014 | $779 | $26,550 | $7,800 | $18,750 |
| 2013 | -- | $26,549 | $7,800 | $18,749 |
Source: Public Records
Map
Nearby Homes
- 205 Pine St
- 0 College Dr Unit 10632977
- 00 Yatesville Rd Unit 1
- 306 Spencer St
- 0 Yatesville Rd Unit 24570293
- 0 Yatesville Rd Unit 10650403
- 0 Highway 341 S Unit 181569
- 0 Highway 341 S Unit 10610486
- 205 Georgia Ave
- 0 Veterns Pkwy Unit 10515268
- 150 Georgia Ave
- 110 Bradley Cir
- 108 Bradley Cir
- 308 Moye St
- 0 Us Highway 41
- 0 U S 341
- 125 Byrd St
- 531 Thomaston St
- 185 Coffey Rd Unit 11
- 303 Carleeta St
- 208 Poplar St
- 209 Pine St
- 204 Poplar St
- 211 Poplar St
- 307 Poplar St
- 205 Pine St Unit `
- 208 Pine St
- 300 Poplar St
- 0 Pine St
- 0 Pine St Unit 8985594
- 0 Pine St Unit 9017724
- 0 Pine St Unit 8917268
- 0 Pine St Unit 8940262
- 0 Pine St Unit 8808054
- 0 Pine St Unit 7290704
- 0 Pine St Unit 7544219
- 0 Pine St Unit 8025862
- 0 Pine St Unit 8235715
- 0 Pine St Unit 8319595
- 0 Pine St Unit 8542520