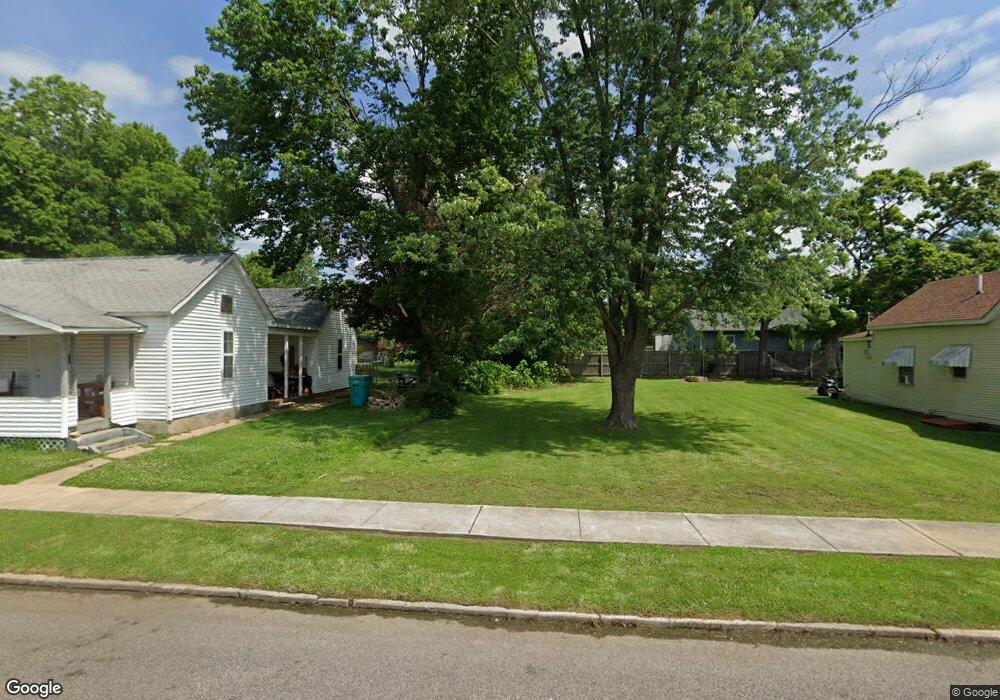
213 Pine St Sullivan, MO 63080
Estimated Value: $262,000 - $349,000
2
Beds
1
Bath
1,382
Sq Ft
$220/Sq Ft
Est. Value
About This Home
This home is located at 213 Pine St, Sullivan, MO 63080 and is currently estimated at $304,000, approximately $219 per square foot. 213 Pine St is a home located in Franklin County with nearby schools including Sullivan Primary School, Sullivan Elementary School, and Sullivan Middle School.
Ownership History
Date
Name
Owned For
Owner Type
Purchase Details
Closed on
Jan 5, 2024
Sold by
Thomure Brothers Properties Llc
Bought by
Sb Properties & Investments Llc
Current Estimated Value
Home Financials for this Owner
Home Financials are based on the most recent Mortgage that was taken out on this home.
Original Mortgage
$562,500
Interest Rate
7.29%
Mortgage Type
Construction
Purchase Details
Closed on
Apr 24, 2009
Sold by
Boesel Charles F
Bought by
Grande Development Corp
Create a Home Valuation Report for This Property
The Home Valuation Report is an in-depth analysis detailing your home's value as well as a comparison with similar homes in the area
Home Values in the Area
Average Home Value in this Area
Purchase History
| Date | Buyer | Sale Price | Title Company |
|---|---|---|---|
| Sb Properties & Investments Llc | -- | None Listed On Document | |
| Grande Development Corp | -- | None Available |
Source: Public Records
Mortgage History
| Date | Status | Borrower | Loan Amount |
|---|---|---|---|
| Closed | Sb Properties & Investments Llc | $562,500 |
Source: Public Records
Tax History
| Year | Tax Paid | Tax Assessment Tax Assessment Total Assessment is a certain percentage of the fair market value that is determined by local assessors to be the total taxable value of land and additions on the property. | Land | Improvement |
|---|---|---|---|---|
| 2025 | $2,843 | $45,916 | $0 | $0 |
| 2024 | $2,843 | $38,147 | $0 | $0 |
| 2023 | $2,216 | $38,147 | $0 | $0 |
| 2022 | $2,514 | $43,368 | $0 | $0 |
| 2021 | $2,528 | $43,368 | $0 | $0 |
| 2020 | $2,467 | $41,489 | $0 | $0 |
| 2019 | $2,469 | $41,489 | $0 | $0 |
| 2018 | $2,179 | $36,154 | $0 | $0 |
| 2017 | $2,198 | $36,154 | $0 | $0 |
| 2016 | $1,992 | $33,146 | $0 | $0 |
| 2015 | $1,997 | $33,146 | $0 | $0 |
| 2014 | $1,952 | $33,450 | $0 | $0 |
Source: Public Records
Map
Nearby Homes
Your Personal Tour Guide
Ask me questions while you tour the home.