Estimated Value: $145,000 - $158,000
3
Beds
1
Bath
912
Sq Ft
$167/Sq Ft
Est. Value
About This Home
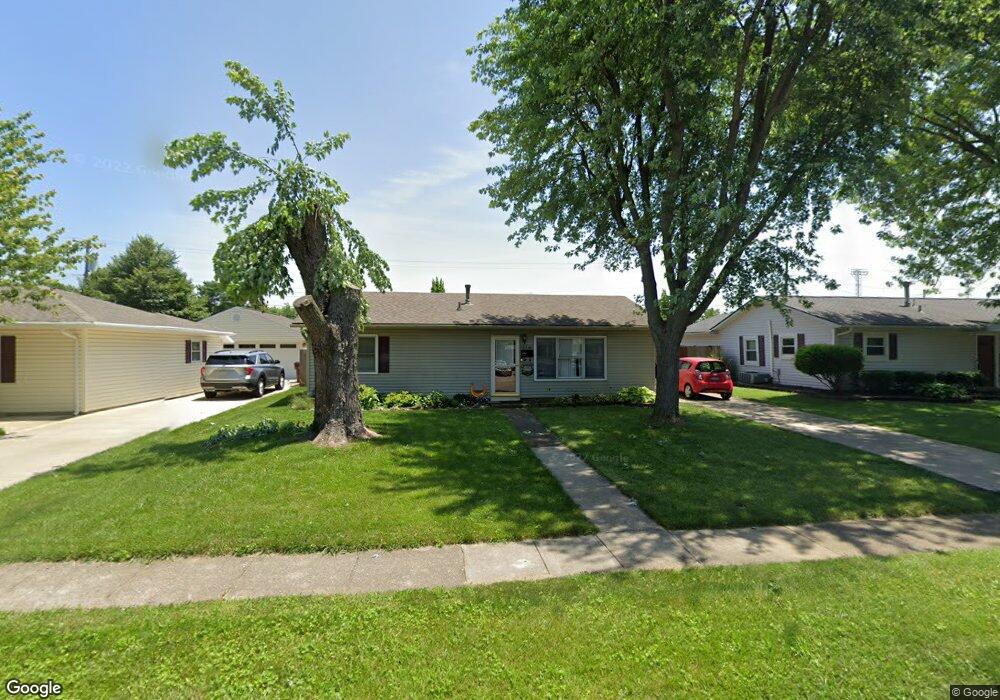
This home is located at 213 Poe Ln, Xenia, OH 45385 and is currently estimated at $152,394, approximately $167 per square foot. 213 Poe Ln is a home located in Greene County with nearby schools including Xenia High School, Summit Academy Community School for Alternative Learners - Xenia, and Legacy Christian Academy.
Ownership History
Date
Name
Owned For
Owner Type
Purchase Details
Closed on
Feb 23, 2012
Sold by
Friesen Melissa J
Bought by
Clark Nina H and Laforce Helen Francis
Current Estimated Value
Purchase Details
Closed on
Jun 2, 2003
Sold by
Fairchild Jeffrey L
Bought by
Friesen Melissa J
Home Financials for this Owner
Home Financials are based on the most recent Mortgage that was taken out on this home.
Original Mortgage
$69,900
Interest Rate
5.88%
Mortgage Type
Unknown
Create a Home Valuation Report for This Property
The Home Valuation Report is an in-depth analysis detailing your home's value as well as a comparison with similar homes in the area
Home Values in the Area
Average Home Value in this Area
Purchase History
| Date | Buyer | Sale Price | Title Company |
|---|---|---|---|
| Clark Nina H | $67,000 | Attorney | |
| Friesen Melissa J | $69,900 | -- |
Source: Public Records
Mortgage History
| Date | Status | Borrower | Loan Amount |
|---|---|---|---|
| Previous Owner | Friesen Melissa J | $69,900 |
Source: Public Records
Tax History Compared to Growth
Tax History
| Year | Tax Paid | Tax Assessment Tax Assessment Total Assessment is a certain percentage of the fair market value that is determined by local assessors to be the total taxable value of land and additions on the property. | Land | Improvement |
|---|---|---|---|---|
| 2024 | $1,017 | $34,200 | $9,350 | $24,850 |
| 2023 | $1,017 | $34,200 | $9,350 | $24,850 |
| 2022 | $739 | $23,860 | $6,680 | $17,180 |
| 2021 | $749 | $23,860 | $6,680 | $17,180 |
| 2020 | $1,132 | $23,860 | $6,680 | $17,180 |
| 2019 | $1,032 | $20,480 | $4,600 | $15,880 |
| 2018 | $1,036 | $20,480 | $4,600 | $15,880 |
| 2017 | $1,006 | $20,480 | $4,600 | $15,880 |
| 2016 | $991 | $19,240 | $4,600 | $14,640 |
| 2015 | $694 | $19,240 | $4,600 | $14,640 |
| 2014 | $951 | $19,240 | $4,600 | $14,640 |
Source: Public Records
Map
Nearby Homes