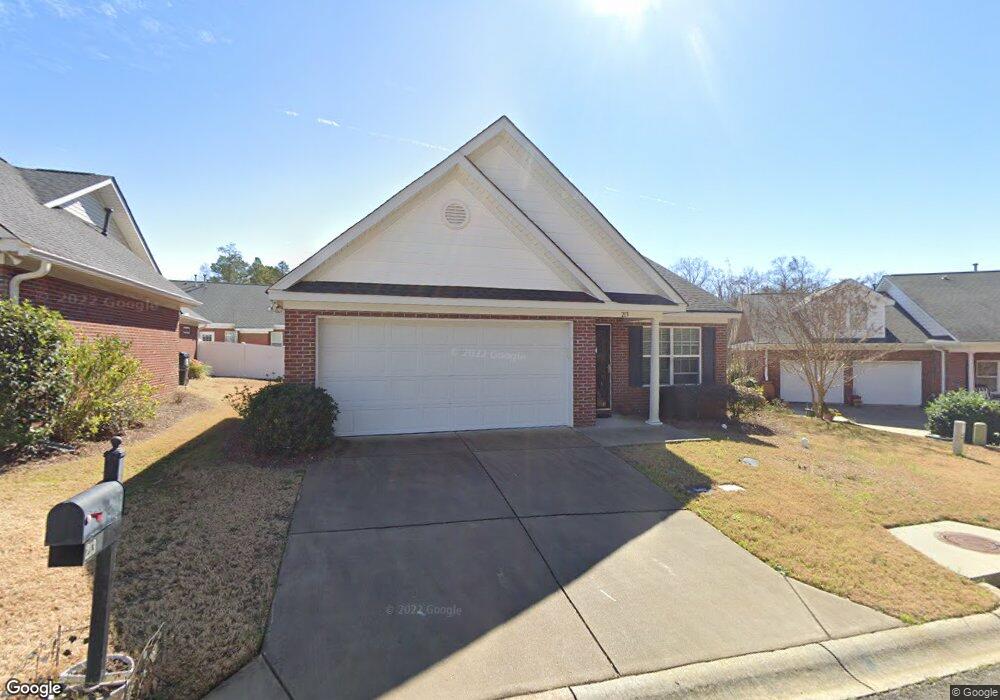
213 Potano Ct Unit 10 Lexington, SC 29072
Estimated Value: $222,000 - $270,000
2
Beds
2
Baths
1,296
Sq Ft
$193/Sq Ft
Est. Value
About This Home
This home is located at 213 Potano Ct Unit 10, Lexington, SC 29072 and is currently estimated at $249,884, approximately $192 per square foot. 213 Potano Ct Unit 10 is a home located in Lexington County with nearby schools including New Providence Elementary School, Beechwood Middle School, and Lexington High School.
Ownership History
Date
Name
Owned For
Owner Type
Purchase Details
Closed on
Aug 19, 2011
Sold by
Mcguinn Holdings Llc
Bought by
Brown Myra L
Current Estimated Value
Home Financials for this Owner
Home Financials are based on the most recent Mortgage that was taken out on this home.
Original Mortgage
$76,500
Outstanding Balance
$6,307
Interest Rate
4.53%
Mortgage Type
Future Advance Clause Open End Mortgage
Estimated Equity
$243,577
Purchase Details
Closed on
May 16, 2011
Sold by
Mcguinn Construction Management Inc
Bought by
Mcguinn Holdings Llc
Home Financials for this Owner
Home Financials are based on the most recent Mortgage that was taken out on this home.
Original Mortgage
$112,000
Interest Rate
4.88%
Mortgage Type
Purchase Money Mortgage
Purchase Details
Closed on
Jan 30, 2008
Sold by
Cherokee Townhomes Llc
Bought by
Mcguinn Construction Management Inc
Create a Home Valuation Report for This Property
The Home Valuation Report is an in-depth analysis detailing your home's value as well as a comparison with similar homes in the area
Home Values in the Area
Average Home Value in this Area
Purchase History
| Date | Buyer | Sale Price | Title Company |
|---|---|---|---|
| Brown Myra L | $136,500 | -- | |
| Mcguinn Holdings Llc | $34,876 | -- | |
| Mcguinn Construction Management Inc | $640,000 | None Available |
Source: Public Records
Mortgage History
| Date | Status | Borrower | Loan Amount |
|---|---|---|---|
| Open | Brown Myra L | $76,500 | |
| Previous Owner | Mcguinn Holdings Llc | $112,000 |
Source: Public Records
Tax History Compared to Growth
Tax History
| Year | Tax Paid | Tax Assessment Tax Assessment Total Assessment is a certain percentage of the fair market value that is determined by local assessors to be the total taxable value of land and additions on the property. | Land | Improvement |
|---|---|---|---|---|
| 2024 | $909 | $6,092 | $1,185 | $4,907 |
| 2023 | $909 | $6,092 | $1,185 | $4,907 |
| 2022 | $907 | $6,092 | $1,185 | $4,907 |
| 2020 | $930 | $6,092 | $1,185 | $4,907 |
| 2019 | $824 | $5,297 | $1,000 | $4,297 |
| 2018 | $809 | $5,297 | $1,000 | $4,297 |
| 2017 | $785 | $5,297 | $1,000 | $4,297 |
| 2016 | $777 | $5,297 | $1,000 | $4,297 |
| 2014 | $766 | $5,459 | $1,600 | $3,859 |
| 2013 | -- | $5,460 | $1,600 | $3,860 |
Source: Public Records
Map
Nearby Homes
- Ashland Plan at Kensington Place - Townhomes
- Bristol Plan at Kensington Place - Townhomes
- 346 Clarendon Ct
- 161 Vista Oaks Dr
- 117 York Commons
- 101 York Commons
- 143 Belle Chase Dr
- 207 Spring Creek Ct
- 580 Rose Sharon Dr
- 203 Rising Star Ct
- 212 Rising Star Ct
- 221 Yachting Rd
- 227 State Road S-32-145 Unit LOT 1
- 227 State Road S-32-145 Unit LOT 2
- 227 State Road S-32-145 Unit LOT 3
- 247 Clearbrook Cir
- 213 Dove Chase Trail
- 536 Sterling Brook Dr
- 257 Tweng Trail
- 807 Neighbor Ln
- 213 Potano Ct
- 209 Potano Ct
- 209 Potano Ct Unit 11
- 217 Potano Ct
- 126 Vista Oaks Dr
- 122 Vista Oaks Dr
- 205 Potano Ct
- 130 Vista Oaks Dr
- 208 Potano Ct
- 118 Vista Oaks Dr
- 118 Vista Oaks Dr Unit 15
- 204 Potano Ct
- 204 Potano Ct Unit 9
- 134 Vista Oaks Dr
- 201 Potano Ct
- 201 Potano Ct Unit 13
- 114 Vista Oaks Dr
- 200 Potano Ct
- 200 Potano Ct Unit LOT 8
- 117 Potano Dr