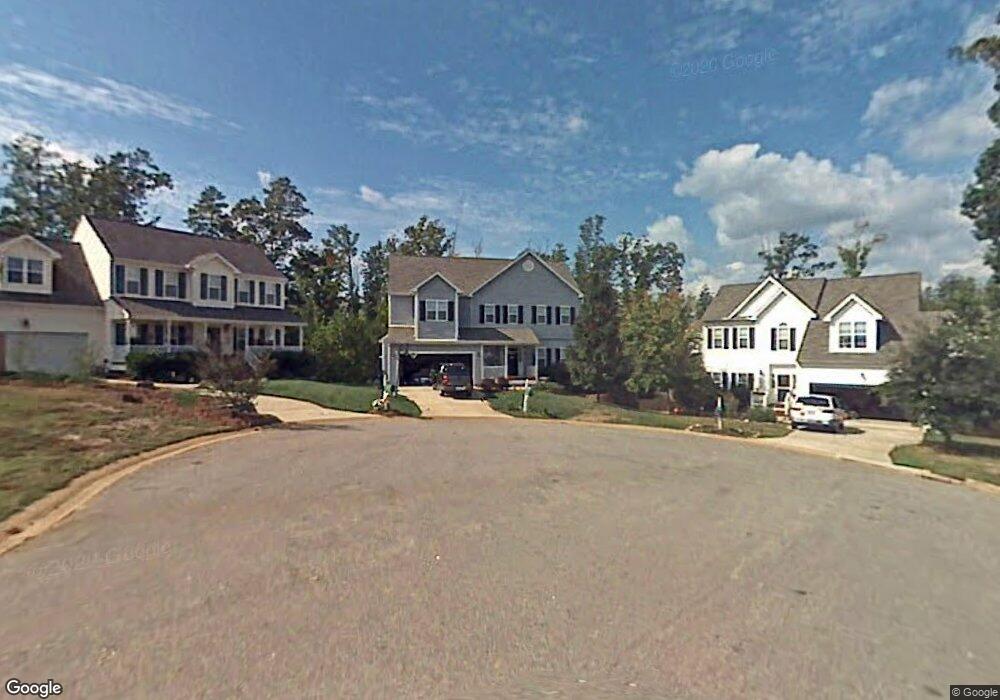
213 Ramshorn Ct Holly Springs, NC 27540
Estimated Value: $521,033 - $540,000
4
Beds
3
Baths
2,414
Sq Ft
$220/Sq Ft
Est. Value
About This Home
This home is located at 213 Ramshorn Ct, Holly Springs, NC 27540 and is currently estimated at $530,758, approximately $219 per square foot. 213 Ramshorn Ct is a home located in Wake County with nearby schools including Oakview Elementary School, Apex Friendship Middle School, and Holly Springs High School.
Ownership History
Date
Name
Owned For
Owner Type
Purchase Details
Closed on
Feb 26, 2018
Sold by
Poucher Christina W
Bought by
Poulcher John W
Current Estimated Value
Home Financials for this Owner
Home Financials are based on the most recent Mortgage that was taken out on this home.
Original Mortgage
$201,254
Outstanding Balance
$171,047
Interest Rate
4.04%
Mortgage Type
New Conventional
Estimated Equity
$359,711
Purchase Details
Closed on
Jan 12, 2001
Sold by
Parker & Lancaster Corp
Bought by
Poucher John W and Poucher Christina W
Home Financials for this Owner
Home Financials are based on the most recent Mortgage that was taken out on this home.
Original Mortgage
$155,600
Interest Rate
7.65%
Purchase Details
Closed on
Jan 5, 2001
Sold by
Builder Resource & Devlp Lmtd Prtns
Bought by
Parker & Lancaster Corp
Home Financials for this Owner
Home Financials are based on the most recent Mortgage that was taken out on this home.
Original Mortgage
$155,600
Interest Rate
7.65%
Create a Home Valuation Report for This Property
The Home Valuation Report is an in-depth analysis detailing your home's value as well as a comparison with similar homes in the area
Home Values in the Area
Average Home Value in this Area
Purchase History
| Date | Buyer | Sale Price | Title Company |
|---|---|---|---|
| Poulcher John W | -- | None Available | |
| Poucher John W | $194,500 | -- | |
| Parker & Lancaster Corp | -- | -- |
Source: Public Records
Mortgage History
| Date | Status | Borrower | Loan Amount |
|---|---|---|---|
| Open | Poulcher John W | $201,254 | |
| Closed | Poucher John W | $155,600 |
Source: Public Records
Tax History Compared to Growth
Tax History
| Year | Tax Paid | Tax Assessment Tax Assessment Total Assessment is a certain percentage of the fair market value that is determined by local assessors to be the total taxable value of land and additions on the property. | Land | Improvement |
|---|---|---|---|---|
| 2025 | $4,102 | $474,329 | $120,000 | $354,329 |
| 2024 | $4,085 | $474,329 | $120,000 | $354,329 |
| 2023 | $3,352 | $308,878 | $50,000 | $258,878 |
| 2022 | $3,236 | $308,878 | $50,000 | $258,878 |
| 2021 | $3,176 | $308,878 | $50,000 | $258,878 |
| 2020 | $3,176 | $308,878 | $50,000 | $258,878 |
| 2019 | $2,963 | $244,600 | $48,000 | $196,600 |
| 2018 | $2,679 | $244,600 | $48,000 | $196,600 |
| 2017 | $2,582 | $244,600 | $48,000 | $196,600 |
| 2016 | $2,547 | $244,600 | $48,000 | $196,600 |
| 2015 | $2,672 | $252,733 | $48,000 | $204,733 |
| 2014 | $2,580 | $252,733 | $48,000 | $204,733 |
Source: Public Records
Map
Nearby Homes
- 105 Townsgate Ct
- 713 Littleleaf Ct
- 725 Little Leaf Ct
- 761 W Holly Springs Rd
- 755 W Holly Springs Rd
- 749 W Holly Springs Rd
- 743 W Holly Springs Rd
- 737 W Holly Springs Rd
- 109 Bright Shade Ct
- 108 Crabwall Ct
- 717 Starkland Way
- 225 Douglas St
- 124 Cliffdale Rd
- 126 Tuska Hills Dr
- 321 Blalock St
- 112 Burt St
- 321 Cross Hill Ln
- 105 Cross Hill Ln
- 318 Blalock St
- 329 N Main St
- 209 Ramshorn Ct
- 217 Ramshorn Ct
- 205 Ramshorn Ct
- 141 Sudano Ct
- 145 Sudano Ct
- 137 Sudano Ct
- 216 Ramshorn Ct
- 149 Sudano Ct
- 212 Ramshorn Ct
- 100 Moss Rock Ct
- 133 Sudano Ct
- 153 Sudano Ct
- 104 Moss Rock Ct
- 208 Ramshorn Ct
- 204 Ramshorn Ct
- 129 Sudano Ct
- 157 Sudano Ct
- 105 Spooner Ct
- 200 Ramshorn Ct
- 125 Sudano Ct