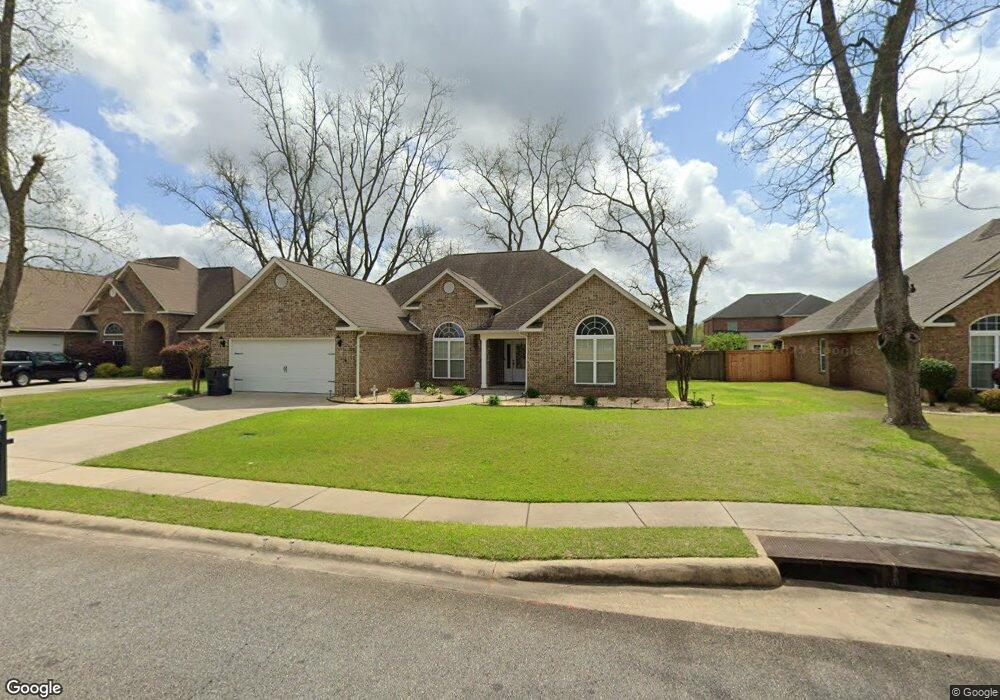
213 Red Hawk Pointe Kathleen, GA 31047
Estimated Value: $319,480 - $373,000
4
Beds
2
Baths
2,122
Sq Ft
$159/Sq Ft
Est. Value
About This Home
This home is located at 213 Red Hawk Pointe, Kathleen, GA 31047 and is currently estimated at $338,370, approximately $159 per square foot. 213 Red Hawk Pointe is a home located in Houston County with nearby schools including Matthew Arthur Elementary School, Perry Middle School, and Veterans High School.
Ownership History
Date
Name
Owned For
Owner Type
Purchase Details
Closed on
Dec 10, 2021
Sold by
Selph Betty A
Bought by
Selph Kevin R
Current Estimated Value
Purchase Details
Closed on
Feb 25, 2020
Sold by
Sizemore Donnie L and Sizemore Carol A
Bought by
Selph Kevin
Home Financials for this Owner
Home Financials are based on the most recent Mortgage that was taken out on this home.
Original Mortgage
$227,003
Interest Rate
3.6%
Mortgage Type
VA
Purchase Details
Closed on
Sep 4, 2008
Sold by
Custom Homes
Bought by
Sizemore Donnie L and Sizemore Carol A
Purchase Details
Closed on
Apr 9, 2008
Sold by
Usa Land Development Inc
Bought by
Custom Homes By Jeff Llc
Home Financials for this Owner
Home Financials are based on the most recent Mortgage that was taken out on this home.
Original Mortgage
$161,010
Interest Rate
6.22%
Mortgage Type
Purchase Money Mortgage
Create a Home Valuation Report for This Property
The Home Valuation Report is an in-depth analysis detailing your home's value as well as a comparison with similar homes in the area
Home Values in the Area
Average Home Value in this Area
Purchase History
| Date | Buyer | Sale Price | Title Company |
|---|---|---|---|
| Selph Kevin R | -- | None Listed On Document | |
| Selph Kevin | $221,900 | None Available | |
| Sizemore Donnie L | $194,900 | None Available | |
| Custom Homes By Jeff Llc | $34,000 | None Available |
Source: Public Records
Mortgage History
| Date | Status | Borrower | Loan Amount |
|---|---|---|---|
| Previous Owner | Selph Kevin | $227,003 | |
| Previous Owner | Custom Homes By Jeff Llc | $161,010 |
Source: Public Records
Tax History Compared to Growth
Tax History
| Year | Tax Paid | Tax Assessment Tax Assessment Total Assessment is a certain percentage of the fair market value that is determined by local assessors to be the total taxable value of land and additions on the property. | Land | Improvement |
|---|---|---|---|---|
| 2024 | $4,187 | $113,960 | $14,000 | $99,960 |
| 2023 | $3,393 | $91,720 | $14,000 | $77,720 |
| 2022 | $2,049 | $89,120 | $14,000 | $75,120 |
| 2021 | $1,980 | $85,640 | $14,000 | $71,640 |
| 2020 | $1,498 | $73,640 | $14,000 | $59,640 |
| 2019 | $1,498 | $73,640 | $14,000 | $59,640 |
| 2018 | $1,498 | $73,640 | $14,000 | $59,640 |
| 2017 | $1,500 | $73,640 | $14,000 | $59,640 |
| 2016 | $1,502 | $73,640 | $14,000 | $59,640 |
| 2015 | $1,502 | $73,640 | $14,000 | $59,640 |
| 2014 | -- | $73,640 | $14,000 | $59,640 |
| 2013 | -- | $73,640 | $14,000 | $59,640 |
Source: Public Records
Map
Nearby Homes
- 701 Amberley Ct
- 204 Black Hawke Ln
- 416 Red Hawk Pointe
- 135 Parkview Grove
- 107 Westchester Trail
- 103 Westchester Trail
- 414 Newport Ave
- 207 Amberley Ct
- 105 Woodwinds Ct
- 108 Bella Ct
- 203 Amberley Ct Unit 105
- 203 Amberley Ct
- 106 Lila Kate Ct
- 123 Amberley Ct
- 162 Talton Rd
- 192 Talton Rd
- 2403 Ga Hwy 127
- 160 Talton Rd
- 230 Old Hollow Way
- 235 Old Hollow Way
- 213 Red Hawk Point
- 215 Red Hawk Point
- 215 Red Hawk Pointe
- 211 Red Hawk Point
- 217 Red Hawk Point
- 217 Red Hawk Pointe
- 219 Black Hawke Ln
- 209 Red Hawk Point
- 217 Black Hawke Ln
- 221 Black Hawke Ln
- 223 Black Hawke Ln Unit 11B,Coventry
- 349 Grand Reserve Way
- 215 Black Hawk Ln
- 215 Black Hawke Ln
- 347 Grand Reserve Way
- 0 Red Hawk Point Unit 8044129
- 0 Red Hawk Point Unit M136203
- 0 Red Hawk Point Unit 133639
- 208 Red Hawk Point
- 225 Black Hawk Ln