Estimated Value: $478,000 - $564,000
Studio
--
Bath
2,151
Sq Ft
$239/Sq Ft
Est. Value
About This Home
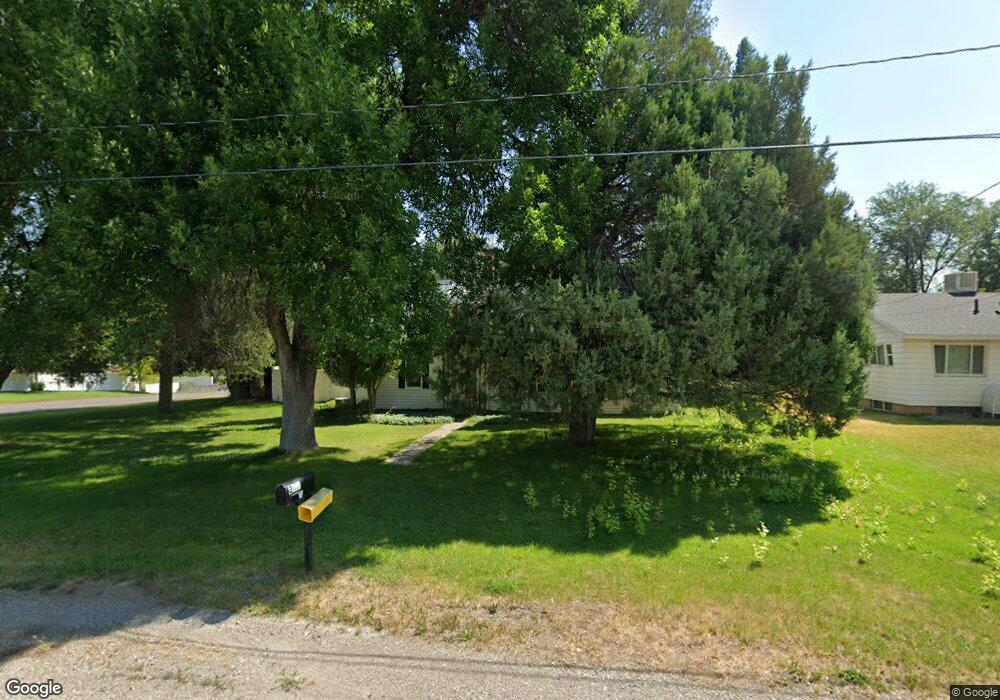
This home is located at 213 S 200 E, Hyrum, UT 84319 and is currently estimated at $513,566, approximately $238 per square foot. 213 S 200 E is a home with nearby schools including Lincoln School, South Cache Middle School, and Mountain Crest High School.
Ownership History
Date
Name
Owned For
Owner Type
Purchase Details
Closed on
May 25, 2016
Sold by
Andersen Jason Lee and Andersen Shayna
Bought by
Andersen Jason and Andersen Shayna
Current Estimated Value
Home Financials for this Owner
Home Financials are based on the most recent Mortgage that was taken out on this home.
Original Mortgage
$167,240
Outstanding Balance
$11,523
Interest Rate
3.66%
Mortgage Type
New Conventional
Estimated Equity
$502,043
Purchase Details
Closed on
Jul 11, 2001
Sold by
Gundersen Joan E
Bought by
Andersen Jason Lee and Andersen Shayna
Home Financials for this Owner
Home Financials are based on the most recent Mortgage that was taken out on this home.
Original Mortgage
$96,000
Interest Rate
7.26%
Create a Home Valuation Report for This Property
The Home Valuation Report is an in-depth analysis detailing your home's value as well as a comparison with similar homes in the area
Home Values in the Area
Average Home Value in this Area
Purchase History
We collect this data history from publicly available records. To have your information removed, we recommend requesting removal directly through your county’s website.
| Date | Buyer | Sale Price | Title Company |
|---|---|---|---|
| Andersen Jason | -- | Hickman Land Title Company | |
| Andersen Jason Lee | -- | Northern Title Company | |
| Andersen Jason Lee | -- | Northern Title Company |
Source: Public Records
Mortgage History
We collect this data history from publicly available records. To have your information removed, we recommend requesting removal directly through your county’s website.
| Date | Status | Borrower | Loan Amount |
|---|---|---|---|
| Open | Andersen Jason | $167,240 | |
| Closed | Andersen Jason Lee | $96,000 |
Source: Public Records
Tax History
| Year | Tax Paid | Tax Assessment Tax Assessment Total Assessment is a certain percentage of the fair market value that is determined by local assessors to be the total taxable value of land and additions on the property. | Land | Improvement |
|---|---|---|---|---|
| 2025 | $1,822 | $261,545 | $0 | $0 |
| 2024 | $1,949 | $261,275 | $0 | $0 |
| 2023 | $1,632 | $209,235 | $0 | $0 |
| 2022 | $1,703 | $209,235 | $0 | $0 |
| 2021 | $1,578 | $298,660 | $65,050 | $233,610 |
| 2020 | $1,378 | $244,750 | $65,050 | $179,700 |
| 2019 | $1,305 | $218,090 | $38,390 | $179,700 |
| 2018 | $1,190 | $192,166 | $38,390 | $153,776 |
| 2017 | $1,153 | $96,630 | $0 | $0 |
| 2016 | $1,179 | $96,630 | $0 | $0 |
| 2015 | $1,182 | $96,630 | $0 | $0 |
| 2014 | $1,154 | $96,465 | $0 | $0 |
| 2013 | -- | $84,140 | $0 | $0 |
Source: Public Records
Map
Nearby Homes
Your Personal Tour Guide
Ask me questions while you tour the home.