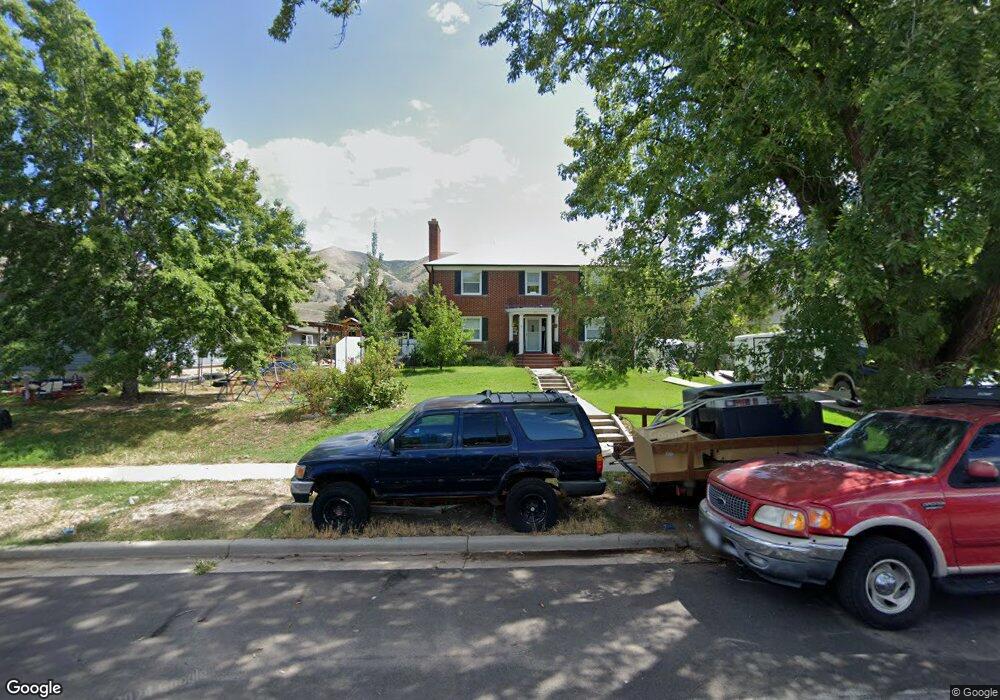
213 S 300 E Brigham City, UT 84302
Estimated Value: $511,000 - $613,000
6
Beds
3
Baths
4,042
Sq Ft
$135/Sq Ft
Est. Value
About This Home
This home is located at 213 S 300 E, Brigham City, UT 84302 and is currently estimated at $544,897, approximately $134 per square foot. 213 S 300 E is a home located in Box Elder County with nearby schools including Golden Spike Elementary, Box Elder Middle School, and Adele C. Young Intermediate School.
Ownership History
Date
Name
Owned For
Owner Type
Purchase Details
Closed on
Mar 7, 2022
Sold by
Eriksen Doug L and Eriksen Douglas L
Bought by
Eriksen Douglas L and Eriksen Misty Lynn
Current Estimated Value
Home Financials for this Owner
Home Financials are based on the most recent Mortgage that was taken out on this home.
Original Mortgage
$340,000
Outstanding Balance
$313,904
Interest Rate
3.55%
Mortgage Type
VA
Estimated Equity
$230,993
Purchase Details
Closed on
Aug 19, 2016
Sold by
Eriksen Doug L
Bought by
Eriksen Doug L and Eriksen Misty Lynn
Home Financials for this Owner
Home Financials are based on the most recent Mortgage that was taken out on this home.
Original Mortgage
$126,400
Interest Rate
3.42%
Mortgage Type
VA
Purchase Details
Closed on
Dec 23, 2004
Sold by
Touchet Joel
Bought by
Np
Purchase Details
Closed on
Nov 30, 2004
Sold by
Matheron Stuart T
Bought by
Not Provided
Create a Home Valuation Report for This Property
The Home Valuation Report is an in-depth analysis detailing your home's value as well as a comparison with similar homes in the area
Purchase History
| Date | Buyer | Sale Price | Title Company |
|---|---|---|---|
| Eriksen Douglas L | -- | Advantage Title Company | |
| Eriksen Doug L | -- | Linear Title Agency Of Utah | |
| Np | $162,828 | American Secure Title | |
| Not Provided | $162,828 | American Secure Title |
Source: Public Records
Mortgage History
| Date | Status | Borrower | Loan Amount |
|---|---|---|---|
| Open | Eriksen Douglas L | $340,000 | |
| Previous Owner | Eriksen Doug L | $126,400 |
Source: Public Records
Tax History
| Year | Tax Paid | Tax Assessment Tax Assessment Total Assessment is a certain percentage of the fair market value that is determined by local assessors to be the total taxable value of land and additions on the property. | Land | Improvement |
|---|---|---|---|---|
| 2025 | -- | $573,497 | $105,000 | $468,497 |
| 2024 | $215 | $576,134 | $100,000 | $476,134 |
| 2023 | $3,261 | $642,806 | $95,000 | $547,806 |
| 2022 | $1,184 | $312,580 | $22,000 | $290,580 |
| 2021 | $2,622 | $362,697 | $40,000 | $322,697 |
| 2020 | $2,232 | $362,697 | $40,000 | $322,697 |
| 2019 | $2,071 | $179,065 | $22,000 | $157,065 |
| 2018 | $0 | $158,578 | $22,000 | $136,578 |
| 2017 | $1,946 | $289,683 | $16,500 | $259,683 |
| 2016 | $2,027 | $152,524 | $16,500 | $136,024 |
| 2015 | -- | $140,158 | $16,500 | $123,658 |
| 2014 | -- | $134,270 | $16,500 | $117,770 |
| 2013 | -- | $134,270 | $16,500 | $117,770 |
Source: Public Records
Map
Nearby Homes
Your Personal Tour Guide
Ask me questions while you tour the home.