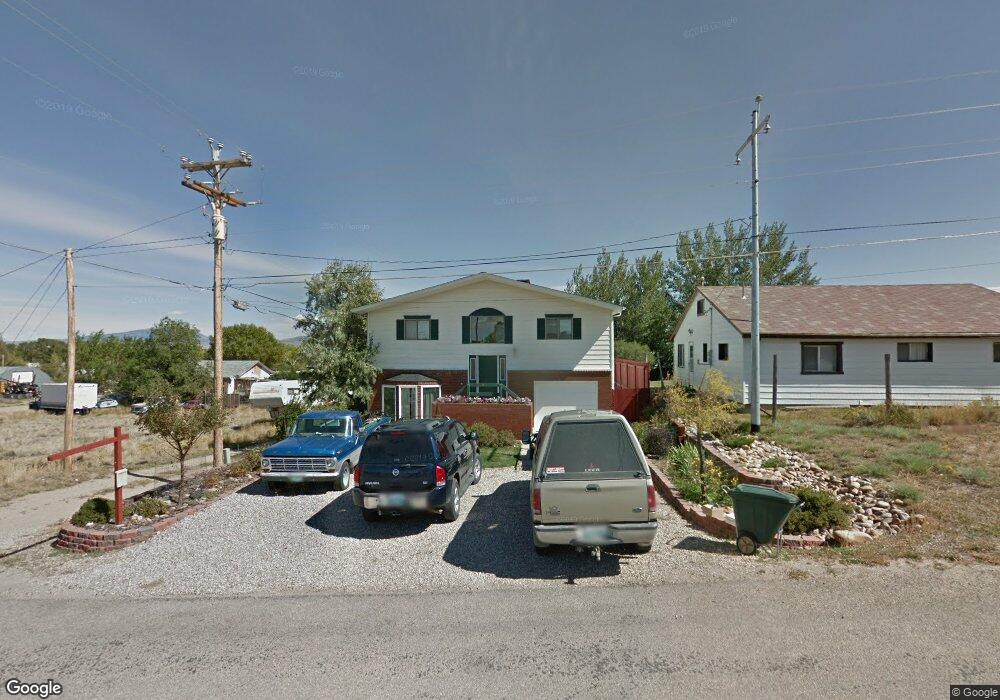
213 S 7th St Saratoga, WY 82331
Estimated Value: $289,821 - $344,000
--
Bed
--
Bath
2,440
Sq Ft
$127/Sq Ft
Est. Value
About This Home
This home is located at 213 S 7th St, Saratoga, WY 82331 and is currently estimated at $309,940, approximately $127 per square foot. 213 S 7th St is a home.
Ownership History
Date
Name
Owned For
Owner Type
Purchase Details
Closed on
Nov 19, 2024
Sold by
Powell Christopher
Bought by
Powell Christopher and Powell Edra A
Current Estimated Value
Purchase Details
Closed on
May 17, 2013
Sold by
Haskins Douglas K and Haskins Hollie A
Bought by
Powell Christopher R
Home Financials for this Owner
Home Financials are based on the most recent Mortgage that was taken out on this home.
Original Mortgage
$185,250
Interest Rate
3.41%
Mortgage Type
Commercial
Purchase Details
Closed on
Aug 7, 2009
Sold by
Maskell Peter and Moore Maskell Jennifer J
Bought by
Haskins Douglas K and Haskins Hollie A
Home Financials for this Owner
Home Financials are based on the most recent Mortgage that was taken out on this home.
Original Mortgage
$184,500
Interest Rate
5.44%
Mortgage Type
Commercial
Create a Home Valuation Report for This Property
The Home Valuation Report is an in-depth analysis detailing your home's value as well as a comparison with similar homes in the area
Home Values in the Area
Average Home Value in this Area
Purchase History
| Date | Buyer | Sale Price | Title Company |
|---|---|---|---|
| Powell Christopher | -- | None Listed On Document | |
| Powell Christopher | -- | None Listed On Document | |
| Powell Christopher R | -- | None Available | |
| Haskins Douglas K | -- | None Available |
Source: Public Records
Mortgage History
| Date | Status | Borrower | Loan Amount |
|---|---|---|---|
| Previous Owner | Powell Christopher R | $185,250 | |
| Previous Owner | Haskins Douglas K | $184,500 |
Source: Public Records
Tax History Compared to Growth
Tax History
| Year | Tax Paid | Tax Assessment Tax Assessment Total Assessment is a certain percentage of the fair market value that is determined by local assessors to be the total taxable value of land and additions on the property. | Land | Improvement |
|---|---|---|---|---|
| 2025 | $2,312 | $22,650 | $2,406 | $20,244 |
| 2024 | $2,312 | $32,797 | $3,085 | $29,712 |
| 2023 | $2,227 | $31,584 | $2,730 | $28,854 |
| 2022 | $1,791 | $25,408 | $1,808 | $23,600 |
| 2021 | $1,791 | $21,492 | $1,808 | $19,684 |
| 2020 | $1,457 | $41,942 | $3,616 | $38,326 |
| 2019 | $1,463 | $21,050 | $1,808 | $19,242 |
| 2018 | $1,430 | $20,578 | $1,808 | $18,770 |
| 2017 | $1,396 | $20,081 | $1,808 | $18,273 |
| 2016 | $1,359 | $19,560 | $1,808 | $17,752 |
| 2015 | -- | $17,984 | $1,305 | $16,679 |
| 2014 | -- | $17,745 | $1,305 | $16,440 |
Source: Public Records
Map
Nearby Homes
- Lot 1-12 W Bridge Ave
- Unit D W Bridge Ave
- 616 W Main Ave
- 807 W Saratoga Ave
- 406 W
- 509 W Farm Ave
- 314 S 2nd St
- 304 S 2nd St
- 405 Walnut Ct E
- 1109 W Main Ave
- 0 W Bridge St Unit 20255117
- 1108 W Rochester Ave
- 514 W Hugus Ave
- Lot 1 Bridge Ave
- 104 NE River St
- 900 N 1st St
- 238 Airport
- 232 Airport
- 234 Airport
- 1020 S Veterans St
- 612 W Elm Ave
- 607 W Spring Ave
- 706 W Elm Ave
- 808 W Elm Ave
- 214 S 7th St
- 606 W Elm Ave
- 604 W Elm Ave
- 610 W Spring Ave
- 118 S 7th St
- 118 S 6th St
- 619 W Bridge Ave
- 511 W Spring Ave
- 617 W Bridge Ave
- 102 S 7th St
- 710 W Spring Ave
- 104 S 6th St
- 711 W Bridge
- 509 W Spring Ave
- 510 W Spring Ave
- 508 W Spring Ave