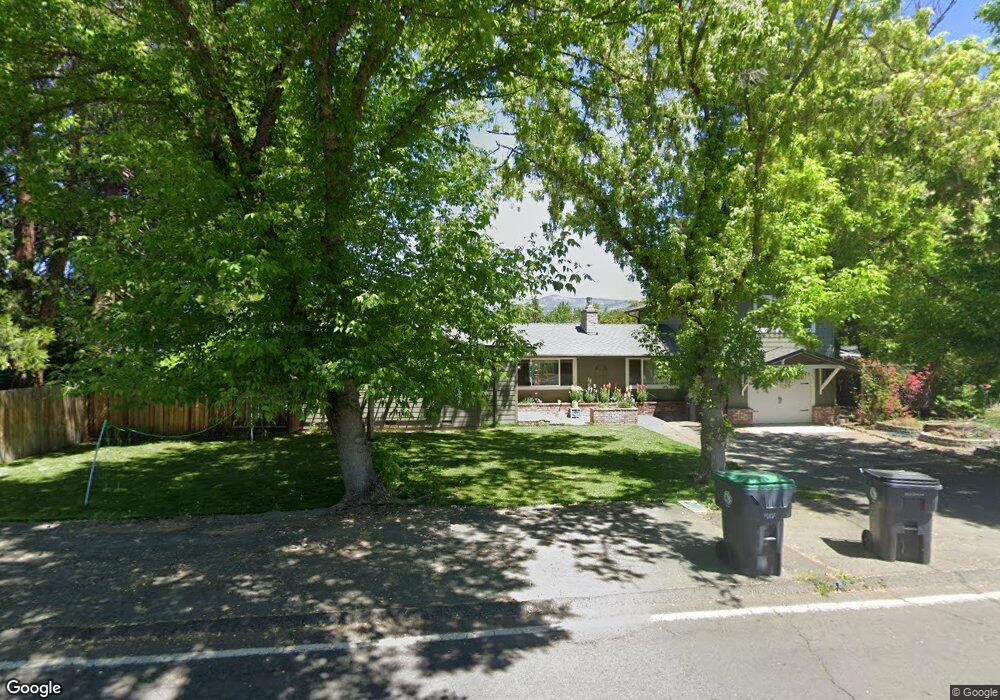
213 S B St Phoenix, OR 97535
Estimated Value: $406,000 - $447,000
4
Beds
2
Baths
1,689
Sq Ft
$251/Sq Ft
Est. Value
About This Home
This home is located at 213 S B St, Phoenix, OR 97535 and is currently estimated at $424,186, approximately $251 per square foot. 213 S B St is a home located in Jackson County with nearby schools including Phoenix Elementary School, Talent Middle School, and Phoenix High School.
Ownership History
Date
Name
Owned For
Owner Type
Purchase Details
Closed on
Apr 19, 2018
Sold by
Mtglq Investors Lp
Bought by
Forderer Tom
Current Estimated Value
Purchase Details
Closed on
Apr 13, 2018
Sold by
Mtglq Investors Lp
Bought by
Forderer Tom
Purchase Details
Closed on
Jul 17, 2017
Sold by
Walaitis Donald
Bought by
Mtglq Investors Lp
Purchase Details
Closed on
Nov 6, 2004
Sold by
Kinworthy Judy
Bought by
Walaitis Donald
Home Financials for this Owner
Home Financials are based on the most recent Mortgage that was taken out on this home.
Original Mortgage
$122,400
Interest Rate
4.87%
Mortgage Type
Purchase Money Mortgage
Purchase Details
Closed on
Oct 29, 1998
Sold by
Kirkpatrick Thomas P and Kirkpatrick Brenda S
Bought by
Mendenhall Moriah
Home Financials for this Owner
Home Financials are based on the most recent Mortgage that was taken out on this home.
Original Mortgage
$27,500
Interest Rate
6.6%
Mortgage Type
Purchase Money Mortgage
Create a Home Valuation Report for This Property
The Home Valuation Report is an in-depth analysis detailing your home's value as well as a comparison with similar homes in the area
Home Values in the Area
Average Home Value in this Area
Purchase History
| Date | Buyer | Sale Price | Title Company |
|---|---|---|---|
| Forderer Tom | $175,000 | None Listed On Document | |
| Forderer Tom | $175,000 | None Available | |
| Mtglq Investors Lp | $154,000 | None Available | |
| Walaitis Donald | $153,000 | Lawyers Title Ins | |
| Mendenhall Moriah | $97,500 | Amerititle |
Source: Public Records
Mortgage History
| Date | Status | Borrower | Loan Amount |
|---|---|---|---|
| Previous Owner | Walaitis Donald | $122,400 | |
| Previous Owner | Mendenhall Moriah | $27,500 | |
| Closed | Walaitis Donald | $22,950 |
Source: Public Records
Tax History
| Year | Tax Paid | Tax Assessment Tax Assessment Total Assessment is a certain percentage of the fair market value that is determined by local assessors to be the total taxable value of land and additions on the property. | Land | Improvement |
|---|---|---|---|---|
| 2026 | $3,984 | $249,820 | -- | -- |
| 2024 | $3,889 | $235,490 | $58,240 | $177,250 |
| 2022 | $4,345 | $228,640 | $56,540 | $172,100 |
| 2021 | $4,133 | $221,990 | $54,890 | $167,100 |
| 2020 | $4,049 | $215,530 | $53,290 | $162,240 |
| 2019 | $3,839 | $203,170 | $50,220 | $152,950 |
| 2018 | $2,394 | $144,140 | $48,750 | $95,390 |
| 2017 | $2,262 | $144,140 | $48,750 | $95,390 |
| 2016 | $2,201 | $135,880 | $45,950 | $89,930 |
| 2015 | $2,115 | $135,880 | $45,950 | $89,930 |
| 2014 | $2,035 | $128,090 | $43,310 | $84,780 |
Source: Public Records
Map
Nearby Homes
- 201 S Rose St
- 130 Sharon Dr
- 105 W 1st St
- 3712 Colver Rd
- 316 W 3rd St
- 301 N Church St
- 454 Elm St
- 111 E 1st St
- 3459 S Pacific Hwy
- 105 Houston Rd
- 4624 S Pacific Hwy Unit 61
- 510 N Main St
- 600 N Main St
- 610 N Main St Unit 5A
- 612 N Main St
- 4601 S Pacific Hwy Unit 8
- 0 Colver Rd
- 418 Phoenix Hills Dr
- 4729 S Pacific Hwy Unit 4
- 4729 S Pacific Hwy Unit 16
Your Personal Tour Guide
Ask me questions while you tour the home.