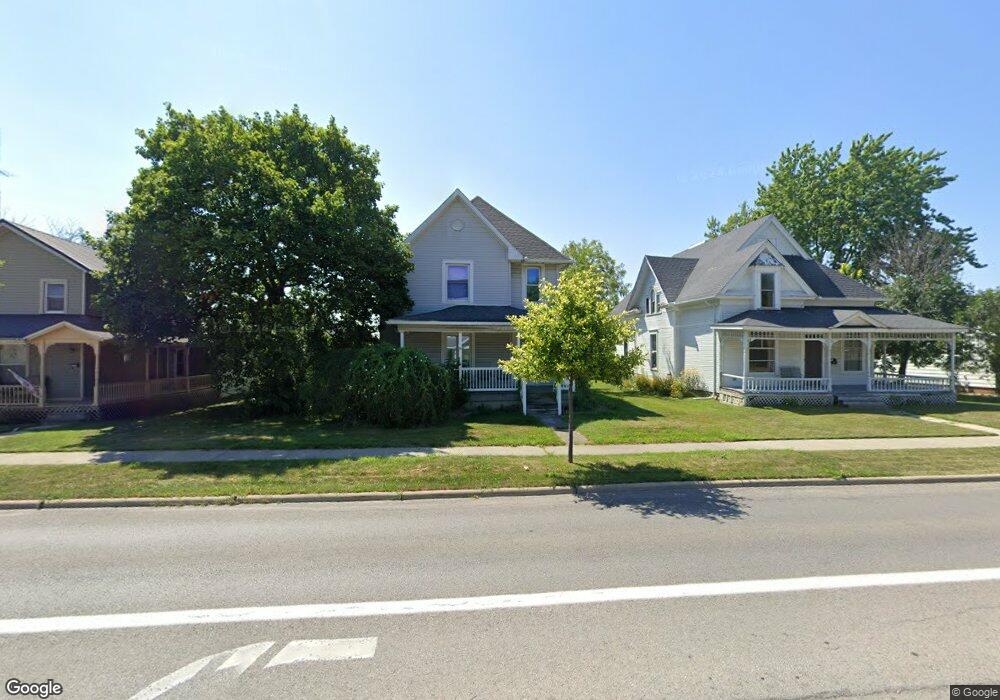
213 S Defiance St Archbold, OH 43502
Estimated Value: $184,000 - $204,000
4
Beds
2
Baths
1,756
Sq Ft
$109/Sq Ft
Est. Value
About This Home
This home is located at 213 S Defiance St, Archbold, OH 43502 and is currently estimated at $191,631, approximately $109 per square foot. 213 S Defiance St is a home located in Fulton County with nearby schools including Archbold Elementary School, Archbold Middle School, and Archbold High School.
Ownership History
Date
Name
Owned For
Owner Type
Purchase Details
Closed on
Apr 4, 2011
Sold by
Household Realty Corporation
Bought by
Rutledge Daniel O
Current Estimated Value
Home Financials for this Owner
Home Financials are based on the most recent Mortgage that was taken out on this home.
Original Mortgage
$62,997
Interest Rate
4.91%
Mortgage Type
FHA
Purchase Details
Closed on
Jan 12, 2011
Sold by
Flores Jesus
Bought by
Household Realty Corporation
Purchase Details
Closed on
Feb 6, 2008
Sold by
Flores Jesus
Bought by
Flores Melissa
Purchase Details
Closed on
Oct 22, 2002
Sold by
Graber Steven R
Bought by
Flores Jesus
Home Financials for this Owner
Home Financials are based on the most recent Mortgage that was taken out on this home.
Original Mortgage
$93,810
Interest Rate
9.5%
Mortgage Type
New Conventional
Purchase Details
Closed on
Jan 1, 1990
Bought by
Graber Steven R
Create a Home Valuation Report for This Property
The Home Valuation Report is an in-depth analysis detailing your home's value as well as a comparison with similar homes in the area
Home Values in the Area
Average Home Value in this Area
Purchase History
| Date | Buyer | Sale Price | Title Company |
|---|---|---|---|
| Rutledge Daniel O | $48,000 | Omega Title Agency Llc | |
| Household Realty Corporation | $60,000 | None Available | |
| Flores Melissa | -- | Attorney | |
| Flores Jesus | $91,000 | -- | |
| Graber Steven R | -- | -- |
Source: Public Records
Mortgage History
| Date | Status | Borrower | Loan Amount |
|---|---|---|---|
| Previous Owner | Rutledge Daniel O | $62,997 | |
| Previous Owner | Flores Jesus | $93,810 |
Source: Public Records
Tax History Compared to Growth
Tax History
| Year | Tax Paid | Tax Assessment Tax Assessment Total Assessment is a certain percentage of the fair market value that is determined by local assessors to be the total taxable value of land and additions on the property. | Land | Improvement |
|---|---|---|---|---|
| 2024 | $2,672 | $51,700 | $6,900 | $44,800 |
| 2023 | $2,672 | $51,700 | $6,900 | $44,800 |
| 2022 | $1,900 | $38,920 | $5,740 | $33,180 |
| 2021 | $1,902 | $38,920 | $5,740 | $33,180 |
| 2020 | $1,893 | $38,920 | $5,740 | $33,180 |
| 2019 | $1,759 | $34,480 | $5,740 | $28,740 |
| 2018 | $1,552 | $34,480 | $5,740 | $28,740 |
| 2017 | $1,506 | $34,480 | $5,740 | $28,740 |
| 2016 | $1,493 | $30,730 | $5,740 | $24,990 |
| 2015 | $1,308 | $30,730 | $5,740 | $24,990 |
| 2014 | $1,308 | $30,730 | $5,740 | $24,990 |
| 2013 | $1,420 | $31,820 | $4,660 | $27,160 |
Source: Public Records
Map
Nearby Homes
- 307 Middle St
- 0 S Defiance St
- 808 West St
- 200 Burke St
- 0 Lafayette St
- 404 Walnut St
- 300 Degroff Ave
- 112 Sylvanus St
- 804 Murbach St
- 813 Murbach St
- 301 N Pointe Dr
- 433 Primrose Ln
- 552 Quail Run
- 24218 State Route 2
- 209 Hawthorn Dr
- 0 County Road F
- 7170 County Road 23
- 352 German St
- 5445 County Road 19
- 22018 County Road F
- 211 S Defiance St
- 0 Union St Unit 6026103
- 0 Union St Unit 6009137
- 0 Union St Unit 4645955
- 0 Union St Unit 5054415
- 209 S Defiance St
- 305 S Defiance St
- 303 S Defiance St
- 207 S Defiance St
- 310 S Defiance St
- 307 S Defiance St
- 212 S Defiance St
- 205 S Defiance St
- 208 S Defiance St
- 300 S Defiance St
- 208 Pleasant St
- 309 S Defiance St
- 204 S Defiance St
- 306 S Defiance St
- 311 S Defiance St