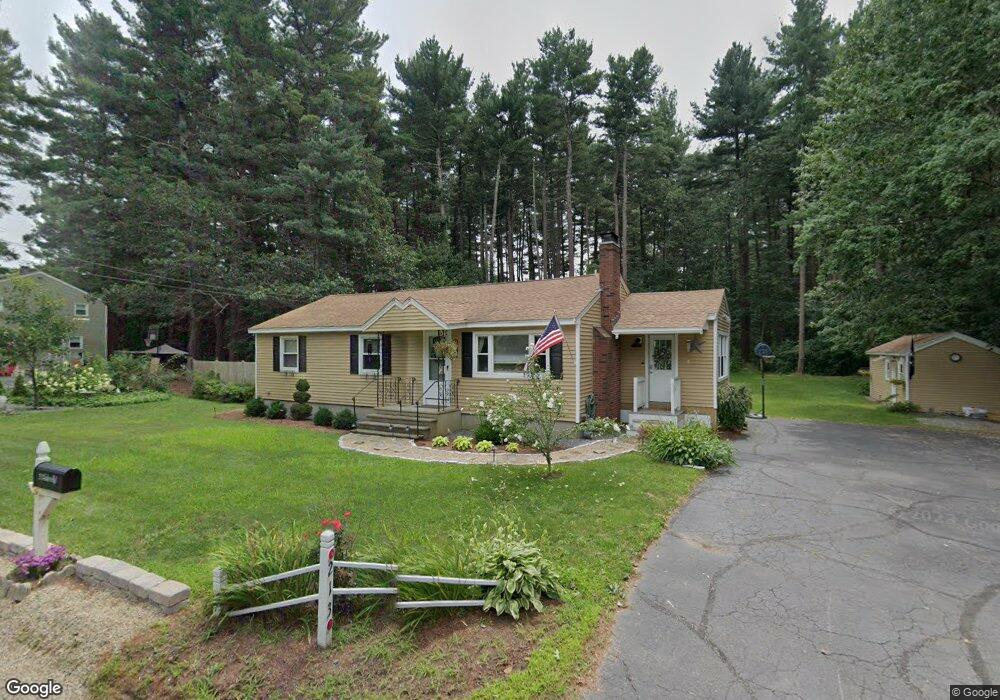
213 Salem Rd Billerica, MA 01821
Estimated Value: $575,000 - $638,000
3
Beds
1
Bath
1,036
Sq Ft
$587/Sq Ft
Est. Value
About This Home
This home is located at 213 Salem Rd, Billerica, MA 01821 and is currently estimated at $608,082, approximately $586 per square foot. 213 Salem Rd is a home located in Middlesex County with nearby schools including Billerica Memorial High School.
Ownership History
Date
Name
Owned For
Owner Type
Purchase Details
Closed on
Mar 31, 2014
Sold by
New Locust Rt
Bought by
Starosciak Keith
Current Estimated Value
Home Financials for this Owner
Home Financials are based on the most recent Mortgage that was taken out on this home.
Original Mortgage
$265,109
Outstanding Balance
$200,847
Interest Rate
4.25%
Mortgage Type
FHA
Estimated Equity
$407,235
Purchase Details
Closed on
May 31, 2013
Sold by
Glassman Eva M and King Elisa B
Bought by
New Locust Rt
Home Financials for this Owner
Home Financials are based on the most recent Mortgage that was taken out on this home.
Original Mortgage
$174,000
Interest Rate
3.45%
Mortgage Type
New Conventional
Create a Home Valuation Report for This Property
The Home Valuation Report is an in-depth analysis detailing your home's value as well as a comparison with similar homes in the area
Home Values in the Area
Average Home Value in this Area
Purchase History
| Date | Buyer | Sale Price | Title Company |
|---|---|---|---|
| Starosciak Keith | $270,000 | -- | |
| New Locust Rt | $180,000 | -- |
Source: Public Records
Mortgage History
| Date | Status | Borrower | Loan Amount |
|---|---|---|---|
| Open | Starosciak Keith | $265,109 | |
| Previous Owner | New Locust Rt | $174,000 |
Source: Public Records
Tax History Compared to Growth
Tax History
| Year | Tax Paid | Tax Assessment Tax Assessment Total Assessment is a certain percentage of the fair market value that is determined by local assessors to be the total taxable value of land and additions on the property. | Land | Improvement |
|---|---|---|---|---|
| 2025 | $6,128 | $539,000 | $320,200 | $218,800 |
| 2024 | $5,563 | $492,700 | $289,200 | $203,500 |
| 2023 | $5,365 | $452,000 | $252,300 | $199,700 |
| 2022 | $4,965 | $392,800 | $221,200 | $171,600 |
| 2021 | $6,840 | $365,700 | $201,800 | $163,900 |
| 2020 | $4,650 | $358,000 | $194,100 | $163,900 |
| 2019 | $4,409 | $327,100 | $182,400 | $144,700 |
| 2018 | $9,890 | $296,200 | $165,000 | $131,200 |
| 2017 | $3,925 | $278,600 | $159,100 | $119,500 |
| 2016 | $3,869 | $273,600 | $154,100 | $119,500 |
| 2015 | $3,722 | $265,100 | $145,600 | $119,500 |
| 2014 | $3,525 | $246,700 | $144,000 | $102,700 |
Source: Public Records
Map
Nearby Homes