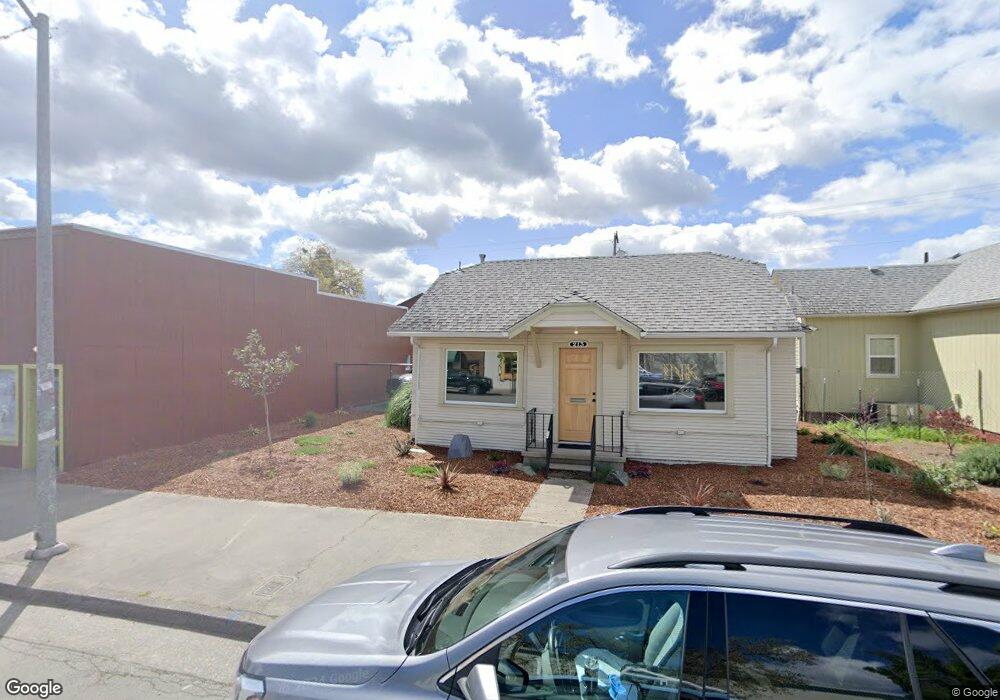
213 SE H St Grants Pass, OR 97526
Estimated Value: $291,000
--
Bed
1
Bath
608
Sq Ft
$479/Sq Ft
Est. Value
About This Home
This home is located at 213 SE H St, Grants Pass, OR 97526 and is currently priced at $291,000, approximately $478 per square foot. 213 SE H St is a home located in Josephine County with nearby schools including Riverside Elementary School, South Middle School, and Grants Pass High School.
Ownership History
Date
Name
Owned For
Owner Type
Purchase Details
Closed on
Feb 25, 2025
Sold by
Prose Lacy
Bought by
Brandon W And Lacy A Prose Revocable Trust and Prose
Current Estimated Value
Purchase Details
Closed on
Jul 15, 2022
Sold by
Lvin Bernard F and Lvin Patricia
Bought by
Prose Lacy
Home Financials for this Owner
Home Financials are based on the most recent Mortgage that was taken out on this home.
Original Mortgage
$190,000
Interest Rate
5.23%
Mortgage Type
New Conventional
Create a Home Valuation Report for This Property
The Home Valuation Report is an in-depth analysis detailing your home's value as well as a comparison with similar homes in the area
Home Values in the Area
Average Home Value in this Area
Purchase History
| Date | Buyer | Sale Price | Title Company |
|---|---|---|---|
| Brandon W And Lacy A Prose Revocable Trust | -- | None Listed On Document | |
| Prose Lacy | $180,000 | None Listed On Document |
Source: Public Records
Mortgage History
| Date | Status | Borrower | Loan Amount |
|---|---|---|---|
| Previous Owner | Prose Lacy | $190,000 |
Source: Public Records
Tax History Compared to Growth
Tax History
| Year | Tax Paid | Tax Assessment Tax Assessment Total Assessment is a certain percentage of the fair market value that is determined by local assessors to be the total taxable value of land and additions on the property. | Land | Improvement |
|---|---|---|---|---|
| 2025 | $1,224 | $94,230 | -- | -- |
| 2024 | $1,224 | $91,490 | -- | -- |
| 2023 | $1,153 | $88,830 | $0 | $0 |
| 2022 | $1,123 | $86,250 | $0 | $0 |
| 2021 | $1,088 | $83,740 | $0 | $0 |
| 2020 | $1,057 | $81,310 | $0 | $0 |
| 2019 | $1,026 | $78,950 | $0 | $0 |
| 2018 | $1,044 | $76,660 | $0 | $0 |
| 2017 | $1,036 | $74,430 | $0 | $0 |
| 2016 | $911 | $72,270 | $0 | $0 |
| 2015 | $882 | $70,170 | $0 | $0 |
| 2014 | $857 | $68,130 | $0 | $0 |
Source: Public Records
Map
Nearby Homes
- 139 SW I St
- 409 SE J St
- 415 SE J St
- 702 SE 9th St
- 303 SW I St
- 330 SW K St
- 710 SE 12th St
- 419 NW D St
- 419 NW C St
- 711 SE Riverside Ave
- 508 NW E St Unit A,B,C
- 728 NW 6th St
- 740 NE 8th St
- 205 SW Booth St
- 619 SE M St
- 811 NE Clyde Place
- 811 NE Clyde Place Unit 116 C
- 708 SW Bridge St
- 719 NW 3rd St
- 737 SE M St