Estimated Value: $282,000 - $302,000
3
Beds
2
Baths
1,750
Sq Ft
$166/Sq Ft
Est. Value
About This Home
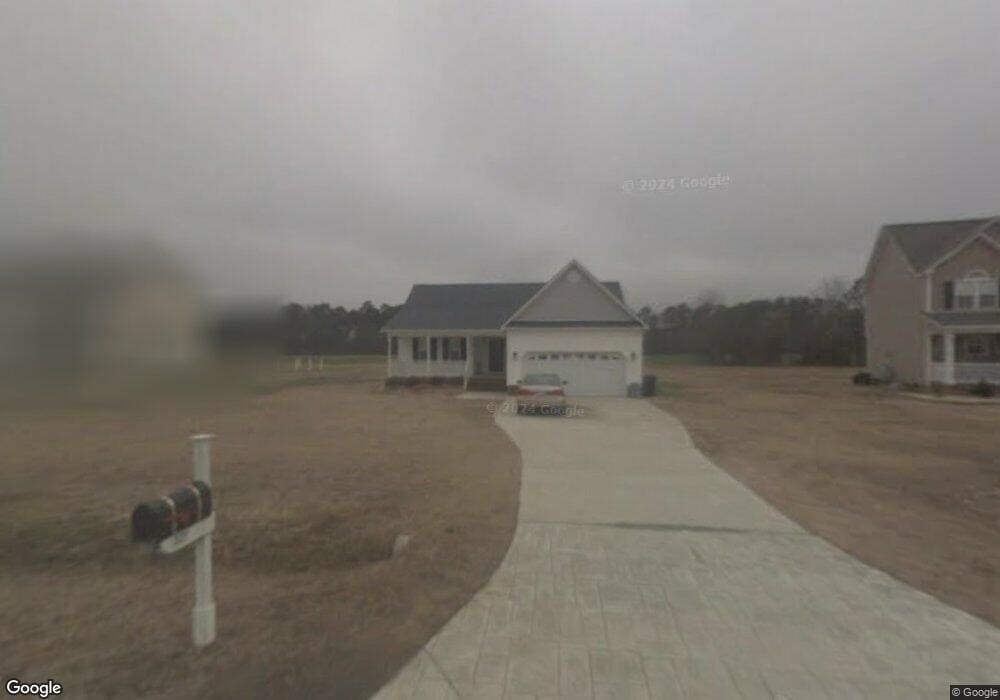
This home is located at 213 Serenity Pointe Dr, Selma, NC 27576 and is currently estimated at $291,222, approximately $166 per square foot. 213 Serenity Pointe Dr is a home located in Johnston County with nearby schools including Micro Elementary School, North Johnston Middle School, and North Johnston High School.
Ownership History
Date
Name
Owned For
Owner Type
Purchase Details
Closed on
Apr 12, 2021
Sold by
Rashid Nabiel and Rashid Hanan
Bought by
Caballero Helmut Victor Mejia
Current Estimated Value
Home Financials for this Owner
Home Financials are based on the most recent Mortgage that was taken out on this home.
Original Mortgage
$207,289
Outstanding Balance
$186,855
Interest Rate
2.9%
Mortgage Type
New Conventional
Estimated Equity
$104,367
Purchase Details
Closed on
Jun 26, 2006
Sold by
Hopkins Ronald J and Hopkins Shelia D
Bought by
Rasbid Nabiel and Rasbid Hanan
Home Financials for this Owner
Home Financials are based on the most recent Mortgage that was taken out on this home.
Original Mortgage
$108,240
Interest Rate
6.6%
Mortgage Type
Purchase Money Mortgage
Create a Home Valuation Report for This Property
The Home Valuation Report is an in-depth analysis detailing your home's value as well as a comparison with similar homes in the area
Home Values in the Area
Average Home Value in this Area
Purchase History
| Date | Buyer | Sale Price | Title Company |
|---|---|---|---|
| Caballero Helmut Victor Mejia | $220,000 | None Available | |
| Rasbid Nabiel | $136,000 | None Available |
Source: Public Records
Mortgage History
| Date | Status | Borrower | Loan Amount |
|---|---|---|---|
| Open | Caballero Helmut Victor Mejia | $207,289 | |
| Previous Owner | Rasbid Nabiel | $108,240 |
Source: Public Records
Tax History Compared to Growth
Tax History
| Year | Tax Paid | Tax Assessment Tax Assessment Total Assessment is a certain percentage of the fair market value that is determined by local assessors to be the total taxable value of land and additions on the property. | Land | Improvement |
|---|---|---|---|---|
| 2025 | $1,875 | $284,040 | $50,000 | $234,040 |
| 2024 | $1,310 | $155,950 | $34,500 | $121,450 |
| 2023 | $1,267 | $154,550 | $34,500 | $120,050 |
| 2022 | $1,329 | $154,550 | $34,500 | $120,050 |
| 2021 | $1,306 | $154,550 | $34,500 | $120,050 |
| 2020 | $1,352 | $154,550 | $34,500 | $120,050 |
| 2019 | $1,352 | $154,550 | $34,500 | $120,050 |
| 2018 | $1,219 | $136,210 | $26,000 | $110,210 |
| 2017 | $1,219 | $136,210 | $26,000 | $110,210 |
| 2016 | $1,192 | $136,210 | $26,000 | $110,210 |
| 2015 | $1,192 | $136,210 | $26,000 | $110,210 |
| 2014 | $1,192 | $136,210 | $26,000 | $110,210 |
Source: Public Records
Map
Nearby Homes
- 1330 Campground Rd
- 38 Chloe Ct
- 73 W Emily Gardens Dr
- 74 W Emily Gardens Dr
- 40 E Emily Gardens Dr
- 12 E Emily Gardens Dr
- 17 W Emily Gardens Dr
- 29 Chloe Ct
- 66 W Emily Gardens Dr
- 8 W Emily Gardens Dr
- 45 E Emily Gardens Dr
- 18 W Emily Gardens Dr
- 37 Chloe Ct
- 43 Chloe Ct
- 40 W Emily Gardens Dr
- 82 W Emily Gardens Dr
- 9 W Emily Gardens Dr
- 22 E Emily Gardens Dr
- 32 W Emily Gardens Dr
- 24 W Emily Gardens Dr
- 193 Serenity Pointe Dr
- 233 Serenity Pointe Dr
- 175 Serenity Pointe Dr
- 251 Serenity Pointe Dr
- 153 Serenity Pointe Dr
- 192 Serenity Pointe Dr
- 250 Serenity Pointe Dr
- 174 Serenity Pointe Dr
- LOT 25 Serenity Pointe Dr
- 0 Serenity Pointe Dr
- 156 Serenity Pointe Dr
- 269 Serenity Pointe Dr
- 135 Serenity Pointe Dr
- 316 Serenity Pointe Dr
- 289 Serenity Pointe Dr
- 105 Serenity Pointe Dr
- 116 Serenity Pointe Dr
- 336 Serenity Pointe Dr
- 327 Serenity Pointe Dr
- 98 Serenity Pointe Dr