213 Sherman Rd Somerset, MA 02726
Brayton Point NeighborhoodEstimated Value: $404,000 - $583,000
4
Beds
2
Baths
1,322
Sq Ft
$358/Sq Ft
Est. Value
About This Home
This home is located at 213 Sherman Rd, Somerset, MA 02726 and is currently estimated at $472,996, approximately $357 per square foot. 213 Sherman Rd is a home located in Bristol County with nearby schools including South Elementary School, Somerset Middle School, and Swansea Wood School.
Ownership History
Date
Name
Owned For
Owner Type
Purchase Details
Closed on
Mar 25, 2019
Sold by
Marvel Gary B
Bought by
Normandin Michael
Current Estimated Value
Purchase Details
Closed on
Aug 8, 2016
Sold by
Mavel Gary B and Mavel Bryan G
Bought by
Mavel Gary B
Purchase Details
Closed on
Feb 26, 2016
Sold by
Mavel Gary B
Bought by
Mavel Bryan G and Mavel Gary B
Create a Home Valuation Report for This Property
The Home Valuation Report is an in-depth analysis detailing your home's value as well as a comparison with similar homes in the area
Home Values in the Area
Average Home Value in this Area
Purchase History
| Date | Buyer | Sale Price | Title Company |
|---|---|---|---|
| Normandin Michael | $150,000 | -- | |
| Normandin Michael | $150,000 | -- | |
| Mavel Gary B | -- | -- | |
| Mavel Gary B | -- | -- | |
| Mavel Bryan G | -- | -- | |
| Mavel Bryan G | -- | -- |
Source: Public Records
Tax History Compared to Growth
Tax History
| Year | Tax Paid | Tax Assessment Tax Assessment Total Assessment is a certain percentage of the fair market value that is determined by local assessors to be the total taxable value of land and additions on the property. | Land | Improvement |
|---|---|---|---|---|
| 2025 | $5,069 | $381,100 | $170,600 | $210,500 |
| 2024 | $4,618 | $361,100 | $170,600 | $190,500 |
| 2023 | $3,966 | $312,800 | $142,000 | $170,800 |
| 2022 | $3,788 | $285,000 | $122,400 | $162,600 |
| 2021 | $3,821 | $260,300 | $110,600 | $149,700 |
| 2020 | $3,730 | $245,100 | $110,600 | $134,500 |
| 2019 | $4,325 | $237,000 | $110,600 | $126,400 |
| 2018 | $3,219 | $215,000 | $105,700 | $109,300 |
| 2017 | $3,511 | $201,800 | $100,400 | $101,400 |
| 2016 | $3,822 | $218,300 | $100,400 | $117,900 |
| 2015 | $3,583 | $206,500 | $106,100 | $100,400 |
| 2014 | $4,748 | $196,600 | $103,000 | $93,600 |
Source: Public Records
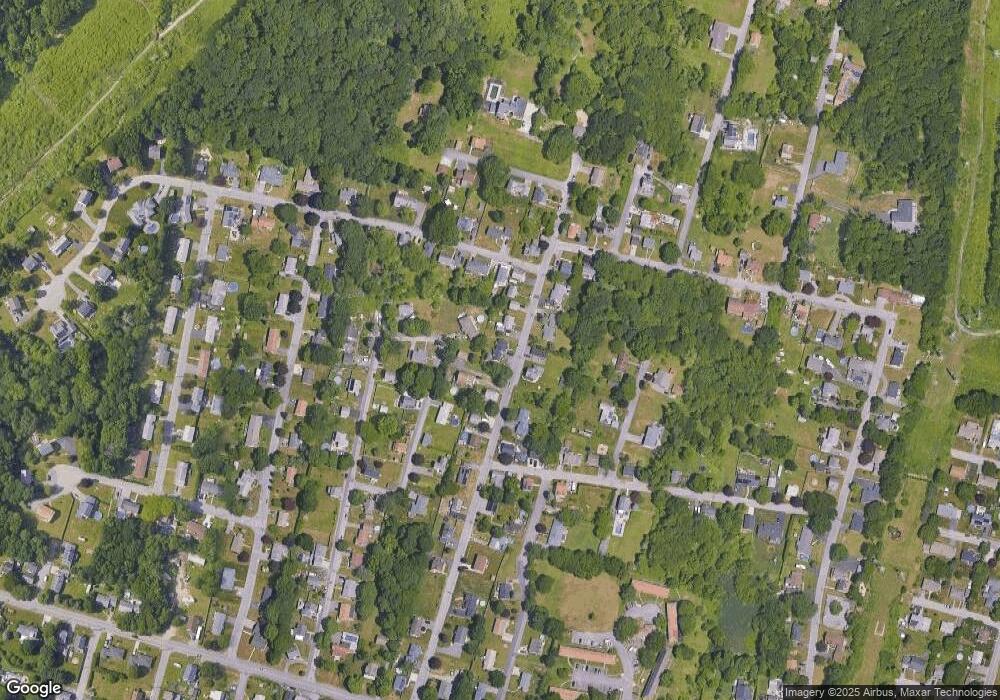
Map
Nearby Homes
- 33 Rhinecliffe Rd
- 197 Alberta Ave
- 126 Jaffrey St
- 24 Knapp St
- 8 Tower Hill Rd
- 675 Lees River Ave
- 34 Base Lodge Ln
- 24 Front St
- 337 Lepes Rd
- 30 Front St
- 8 2nd St
- 265 Stevens Rd
- 0 Bark St Unit 1342599
- 0 Bark St Unit 73152576
- 1 Taunton River
- 80 Meadow Ln
- 66 Meadow Ln
- 21 Bradley Ave
- 105 Cornhill Rd
- 34 Doherty Ave