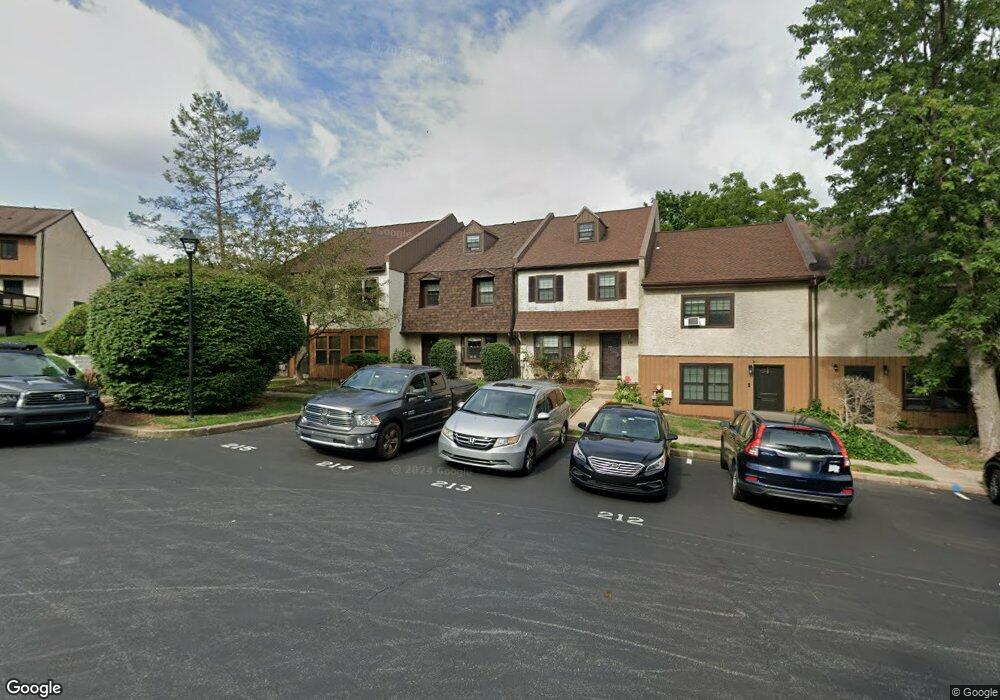
213 Smallwood Ct Unit 213 West Chester, PA 19380
Estimated Value: $372,000 - $500,188
4
Beds
4
Baths
2,640
Sq Ft
$163/Sq Ft
Est. Value
About This Home
This home is located at 213 Smallwood Ct Unit 213, West Chester, PA 19380 and is currently estimated at $430,547, approximately $163 per square foot. 213 Smallwood Ct Unit 213 is a home located in Chester County with nearby schools including Exton Elementary School, J.R. Fugett Middle School, and West Chester East High School.
Ownership History
Date
Name
Owned For
Owner Type
Purchase Details
Closed on
Jul 7, 2009
Sold by
Tribeca Lending Corporation
Bought by
Andrews Kevin and Andrews Brandice T
Current Estimated Value
Home Financials for this Owner
Home Financials are based on the most recent Mortgage that was taken out on this home.
Original Mortgage
$199,224
Interest Rate
5.31%
Mortgage Type
FHA
Purchase Details
Closed on
Feb 26, 2009
Sold by
Kasparian Ira George and Kasparian Kathleen
Bought by
Tribeca Lending Corporation
Purchase Details
Closed on
Jul 28, 1997
Sold by
Sadik Joseph and Sadik Lisa Marie
Bought by
Kasparian Ira George and Kasparian Kathleen
Home Financials for this Owner
Home Financials are based on the most recent Mortgage that was taken out on this home.
Original Mortgage
$106,250
Interest Rate
10.5%
Create a Home Valuation Report for This Property
The Home Valuation Report is an in-depth analysis detailing your home's value as well as a comparison with similar homes in the area
Home Values in the Area
Average Home Value in this Area
Purchase History
| Date | Buyer | Sale Price | Title Company |
|---|---|---|---|
| Andrews Kevin | $176,500 | None Available | |
| Tribeca Lending Corporation | -- | None Available | |
| Kasparian Ira George | $125,000 | -- |
Source: Public Records
Mortgage History
| Date | Status | Borrower | Loan Amount |
|---|---|---|---|
| Previous Owner | Andrews Kevin | $199,224 | |
| Previous Owner | Kasparian Ira George | $106,250 |
Source: Public Records
Tax History Compared to Growth
Tax History
| Year | Tax Paid | Tax Assessment Tax Assessment Total Assessment is a certain percentage of the fair market value that is determined by local assessors to be the total taxable value of land and additions on the property. | Land | Improvement |
|---|---|---|---|---|
| 2025 | $3,560 | $122,800 | $20,820 | $101,980 |
| 2024 | $3,560 | $122,800 | $20,820 | $101,980 |
| 2023 | $3,402 | $122,800 | $20,820 | $101,980 |
| 2022 | $3,356 | $122,800 | $20,820 | $101,980 |
| 2021 | $3,307 | $122,800 | $20,820 | $101,980 |
| 2020 | $3,284 | $122,800 | $20,820 | $101,980 |
| 2019 | $3,237 | $122,800 | $20,820 | $101,980 |
| 2018 | $3,165 | $122,800 | $20,820 | $101,980 |
| 2017 | $3,093 | $122,800 | $20,820 | $101,980 |
| 2016 | $2,742 | $122,800 | $20,820 | $101,980 |
| 2015 | $2,742 | $122,800 | $20,820 | $101,980 |
| 2014 | $2,742 | $122,800 | $20,820 | $101,980 |
Source: Public Records
Map
Nearby Homes
- 193 Stirling Ct
- 1001 Roundhouse Ct Unit 11
- 304 King Rd
- 450 Hartford Square Unit 7
- 591 Coach Hill Ct Unit C32
- 596 Coach Hill Ct Unit C
- 603 Coach Hill Ct Unit B
- 390 Lynetree Dr Unit 8D
- 1402 Redwood Ct Unit 57
- 150 Mountain View Dr
- 108 Mountain View Dr
- 415 Anglesey Terrace
- 1406 Timber Mill Ln
- 1409 Timber Mill Ln
- 456 Cardigan Terrace Unit 456
- 1354 Old Pottstown Pike
- 296 Anglesey Terrace Unit 68
- 150 Brazier Ln
- 706 King Rd
- Kipling Plan at The Woodlands at Brandywine
- 212 Smallwood Ct
- 215 Smallwood Ct
- 214 Smallwood Ct
- 211 Smallwood Ct Unit 211
- 210 Smallwood Ct Unit 210
- 209 Smallwood Ct
- 208 Smallwood Ct
- 109 Wayne Ct Unit 109
- 216 Smallwood Ct
- 108 Wayne Ct
- 207 Smallwood Ct
- 218 Smallwood Ct Unit 218
- 217 Smallwood Ct Unit 217
- 111 Wayne Ct
- 107 Wayne Ct
- 220 Smallwood Ct Unit 220
- 106 Wayne Ct
- 219 Smallwood Ct Unit 219
- 112 Wayne Ct
- 113 Wayne Ct