213 Stites Ave Cape May Court House, NJ 08210
--
Bed
--
Bath
--
Sq Ft
1.91
Acres
About This Home
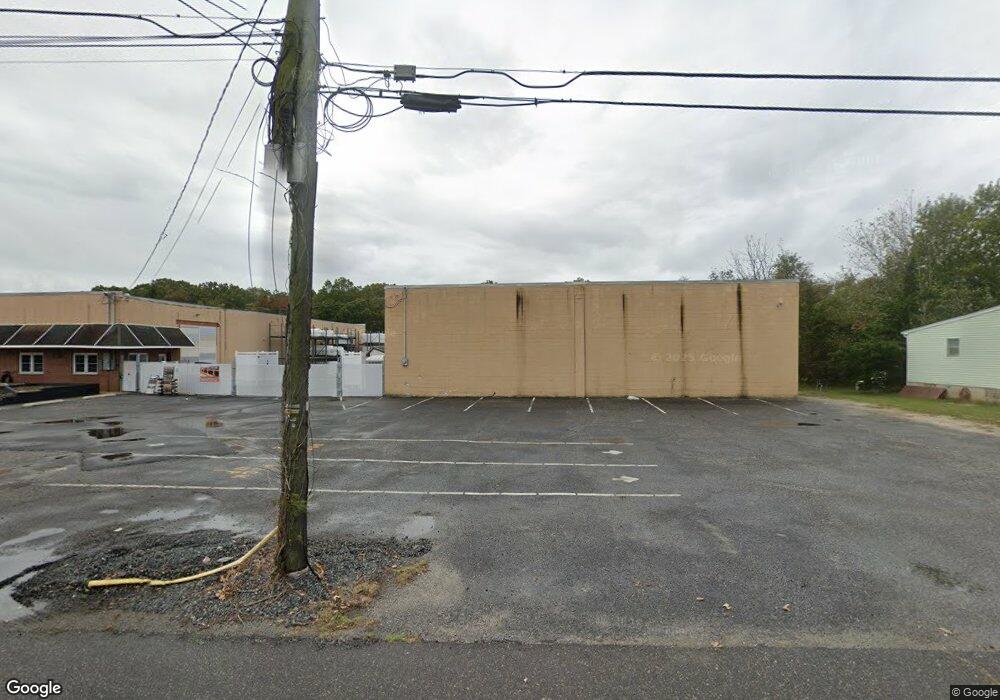
This home is located at 213 Stites Ave, Cape May Court House, NJ 08210. 213 Stites Ave is a home located in Cape May County with nearby schools including Middle Township Elementary No. 1, Middle Township Elementary No. 2, and Middle Township Middle School.
Ownership History
Date
Name
Owned For
Owner Type
Purchase Details
Closed on
Mar 11, 2022
Sold by
Stites Avenue Property Llc
Bought by
Kensington Real Estate Holdings
Home Financials for this Owner
Home Financials are based on the most recent Mortgage that was taken out on this home.
Original Mortgage
$607,700
Interest Rate
3.85%
Mortgage Type
New Conventional
Purchase Details
Closed on
Dec 3, 2021
Sold by
Stites Ave Prop Llc
Bought by
Ckjr Llc
Create a Home Valuation Report for This Property
The Home Valuation Report is an in-depth analysis detailing your home's value as well as a comparison with similar homes in the area
Home Values in the Area
Average Home Value in this Area
Purchase History
| Date | Buyer | Sale Price | Title Company |
|---|---|---|---|
| Kensington Real Estate Holdings | $715,000 | Barrera & Baylinson Pc | |
| Ckjr Llc | $250,000 | None Available | |
| Ckjr Limited Liability Company | $250,000 | Shore Title |
Source: Public Records
Mortgage History
| Date | Status | Borrower | Loan Amount |
|---|---|---|---|
| Previous Owner | Kensington Real Estate Holdings | $607,700 |
Source: Public Records
Tax History Compared to Growth
Tax History
| Year | Tax Paid | Tax Assessment Tax Assessment Total Assessment is a certain percentage of the fair market value that is determined by local assessors to be the total taxable value of land and additions on the property. | Land | Improvement |
|---|---|---|---|---|
| 2025 | $11,713 | $555,400 | $220,000 | $335,400 |
| 2024 | $11,713 | $555,400 | $220,000 | $335,400 |
| 2023 | $11,419 | $555,400 | $220,000 | $335,400 |
| 2022 | $11,091 | $555,400 | $220,000 | $335,400 |
| 2021 | $11,283 | $578,900 | $243,500 | $335,400 |
| 2020 | $11,051 | $578,900 | $243,500 | $335,400 |
| 2019 | $10,768 | $578,900 | $243,500 | $335,400 |
| 2018 | $10,600 | $578,900 | $243,500 | $335,400 |
| 2017 | $10,385 | $578,900 | $243,500 | $335,400 |
| 2016 | $10,125 | $578,900 | $243,500 | $335,400 |
| 2015 | $10,050 | $578,900 | $243,500 | $335,400 |
| 2014 | $9,986 | $578,900 | $243,500 | $335,400 |
Source: Public Records
Map
Nearby Homes