Estimated Value: $358,000 - $384,000
4
Beds
4
Baths
1,944
Sq Ft
$190/Sq Ft
Est. Value
About This Home
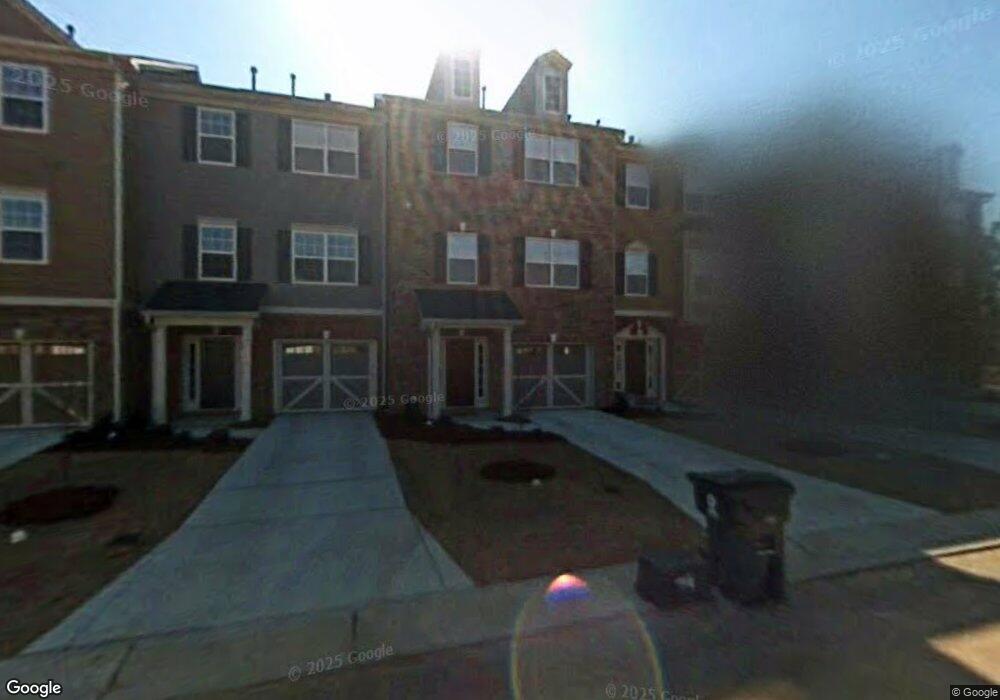
This home is located at 213 Storemont Way, Apex, NC 27539 and is currently estimated at $368,480, approximately $189 per square foot. 213 Storemont Way is a home located in Wake County with nearby schools including Lufkin Road Middle School, Apex Friendship High School, and Pine Springs Prep Academy.
Ownership History
Date
Name
Owned For
Owner Type
Purchase Details
Closed on
Feb 28, 2017
Sold by
Brazile Joscelyn M and Brazile Kyle H
Bought by
Sobrino Ana M Llinas
Current Estimated Value
Home Financials for this Owner
Home Financials are based on the most recent Mortgage that was taken out on this home.
Original Mortgage
$169,600
Outstanding Balance
$140,563
Interest Rate
4.15%
Mortgage Type
New Conventional
Estimated Equity
$227,917
Purchase Details
Closed on
Aug 30, 2007
Sold by
Mccar Homes Raleigh Llc
Bought by
Brazile Joscelyne M and Brazile Kyle H
Home Financials for this Owner
Home Financials are based on the most recent Mortgage that was taken out on this home.
Original Mortgage
$177,950
Interest Rate
6.7%
Mortgage Type
FHA
Create a Home Valuation Report for This Property
The Home Valuation Report is an in-depth analysis detailing your home's value as well as a comparison with similar homes in the area
Home Values in the Area
Average Home Value in this Area
Purchase History
| Date | Buyer | Sale Price | Title Company |
|---|---|---|---|
| Sobrino Ana M Llinas | $212,000 | None Available | |
| Brazile Joscelyne M | $181,000 | None Available |
Source: Public Records
Mortgage History
| Date | Status | Borrower | Loan Amount |
|---|---|---|---|
| Open | Sobrino Ana M Llinas | $169,600 | |
| Previous Owner | Brazile Joscelyne M | $177,950 |
Source: Public Records
Tax History Compared to Growth
Tax History
| Year | Tax Paid | Tax Assessment Tax Assessment Total Assessment is a certain percentage of the fair market value that is determined by local assessors to be the total taxable value of land and additions on the property. | Land | Improvement |
|---|---|---|---|---|
| 2025 | -- | $371,958 | $85,000 | $286,958 |
| 2024 | $3,195 | $371,958 | $85,000 | $286,958 |
| 2023 | $2,590 | $234,259 | $55,000 | $179,259 |
| 2022 | $2,432 | $234,259 | $55,000 | $179,259 |
| 2021 | $2,339 | $234,259 | $55,000 | $179,259 |
| 2020 | $2,316 | $234,259 | $55,000 | $179,259 |
| 2019 | $1,965 | $171,282 | $38,000 | $133,282 |
| 2018 | $1,852 | $171,282 | $38,000 | $133,282 |
| 2017 | $1,724 | $171,282 | $38,000 | $133,282 |
| 2016 | $1,699 | $171,282 | $38,000 | $133,282 |
| 2015 | $1,778 | $175,047 | $41,000 | $134,047 |
| 2014 | $1,714 | $175,047 | $41,000 | $134,047 |
Source: Public Records
Map
Nearby Homes
- 102 Spring Dove Ln
- 314 Cabana Dr
- 3332 Colby Chase Dr Unit Lot 3
- 3340 Colby Chase Dr Unit Lot 2
- 680 Wickham Ridge Rd
- 5417 Bobbitt Rd
- 825 Wickham Ridge Rd
- 5712 Mosley Ave
- 2340 Horton Park Dr
- 108 Bella Place
- 5828 Old Smithfield Rd
- 2273 Horton Park Dr
- 2271 Horton Park Dr
- 300 Firefly Rd
- 2269 Horton Park Dr
- 2267 Horton Park Dr
- 2265 Horton Park Dr
- 2325 Horton Park Dr
- 2332 Horton Park Dr
- 2253 Horton Park Dr
- 211 Storemont Way
- 215 Storemont Way
- 217 Storemont Way
- 209 Storemont Way
- 207 Storemont Way
- 219 Storemont Way
- 205 Storemont Way
- 203 Storemont Way
- 204 Storemont Way
- 201 Storemont Way
- 109 High Ramble Ln
- 107 Gallent Hedge Trail
- 202 Storemont Way
- 109 Gallent Hedge Trail
- 107 High Ramble Ln
- 111 Gallent Hedge Trail
- 206 High Ramble Ln
- 204 High Ramble Ln
- 208 High Ramble Ln
- 113 Gallent Hedge Trail