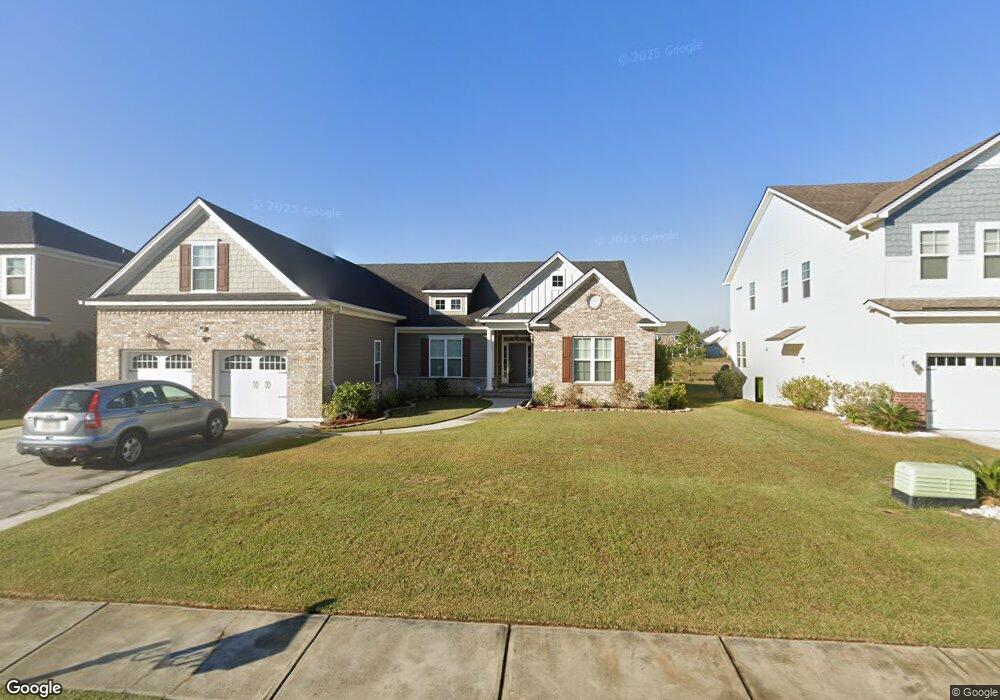
213 Tahoe Dr Pooler, GA 31322
Estimated Value: $509,187 - $574,000
4
Beds
4
Baths
2,920
Sq Ft
$188/Sq Ft
Est. Value
About This Home
This home is located at 213 Tahoe Dr, Pooler, GA 31322 and is currently estimated at $549,297, approximately $188 per square foot. 213 Tahoe Dr is a home located in Chatham County with nearby schools including Godley Station School, Groves High School, and Savannah Adventist Christian School.
Ownership History
Date
Name
Owned For
Owner Type
Purchase Details
Closed on
Aug 7, 2017
Sold by
Landmark 24 Homes Of Savannah
Bought by
Patel Ashokkumar K and Patel Hansa A
Current Estimated Value
Home Financials for this Owner
Home Financials are based on the most recent Mortgage that was taken out on this home.
Original Mortgage
$281,200
Outstanding Balance
$234,640
Interest Rate
3.96%
Mortgage Type
New Conventional
Estimated Equity
$314,657
Purchase Details
Closed on
Mar 15, 2016
Sold by
Forest Lakes Developers Llc
Bought by
Landmark 24 Homes Of Savannah Llc
Home Financials for this Owner
Home Financials are based on the most recent Mortgage that was taken out on this home.
Original Mortgage
$266,250
Interest Rate
3.65%
Mortgage Type
Commercial
Purchase Details
Closed on
Mar 13, 2015
Sold by
Das Suman
Bought by
Das Suman and Das Deyasini Suchitkumar
Create a Home Valuation Report for This Property
The Home Valuation Report is an in-depth analysis detailing your home's value as well as a comparison with similar homes in the area
Home Values in the Area
Average Home Value in this Area
Purchase History
| Date | Buyer | Sale Price | Title Company |
|---|---|---|---|
| Patel Ashokkumar K | $351,500 | -- | |
| Landmark 24 Homes Of Savannah Llc | $45,000 | -- | |
| Landmark 24 Homes Of Savannah Llc | $45,000 | -- | |
| Das Suman | -- | -- | |
| Das Suman | $282,584 | -- |
Source: Public Records
Mortgage History
| Date | Status | Borrower | Loan Amount |
|---|---|---|---|
| Open | Patel Ashokkumar K | $281,200 | |
| Previous Owner | Landmark 24 Homes Of Savannah Llc | $266,250 |
Source: Public Records
Tax History Compared to Growth
Tax History
| Year | Tax Paid | Tax Assessment Tax Assessment Total Assessment is a certain percentage of the fair market value that is determined by local assessors to be the total taxable value of land and additions on the property. | Land | Improvement |
|---|---|---|---|---|
| 2025 | $4,722 | $209,960 | $25,520 | $184,440 |
| 2024 | $4,722 | $205,640 | $23,040 | $182,600 |
| 2023 | $4,005 | $170,520 | $23,040 | $147,480 |
| 2022 | $4,449 | $156,080 | $23,040 | $133,040 |
| 2021 | $4,503 | $136,200 | $23,040 | $113,160 |
| 2020 | $4,434 | $132,560 | $23,040 | $109,520 |
| 2019 | $4,434 | $138,080 | $23,040 | $115,040 |
| 2018 | $4,568 | $133,480 | $23,040 | $110,440 |
| 2017 | $4,292 | $134,040 | $23,040 | $111,000 |
| 2016 | $739 | $23,040 | $23,040 | $0 |
| 2015 | $631 | $23,040 | $23,040 | $0 |
Source: Public Records
Map
Nearby Homes