Estimated Value: $430,000 - $658,700
2
Beds
2
Baths
1,423
Sq Ft
$388/Sq Ft
Est. Value
About This Home
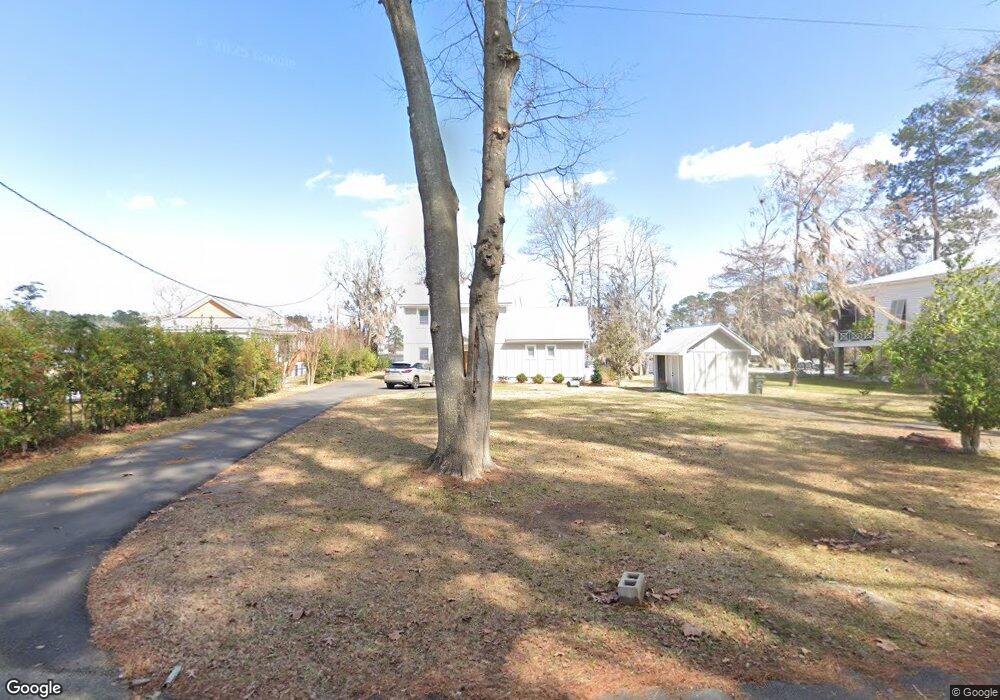
This home is located at 213 Tommy Warren Dr, Cobb, GA 31735 and is currently estimated at $552,675, approximately $388 per square foot. 213 Tommy Warren Dr is a home located in Sumter County with nearby schools including Sumter County Primary School, Sumter County Elementary School, and Sumter County Middle School.
Ownership History
Date
Name
Owned For
Owner Type
Purchase Details
Closed on
Nov 12, 2018
Sold by
Z3 Holdings Llc
Bought by
Hooks Robert Joseph
Current Estimated Value
Purchase Details
Closed on
May 1, 2017
Sold by
Mb One Capital Llc
Bought by
Z3 Holdings Llc
Purchase Details
Closed on
Dec 23, 2013
Sold by
Mcleod Farms Llc
Bought by
Mb One Capital Llc
Purchase Details
Closed on
May 24, 2013
Sold by
Ray Shelby
Bought by
Mcleod Farms Llc
Purchase Details
Closed on
Jun 6, 2003
Sold by
Ray Shelby
Bought by
Ray Shelby
Purchase Details
Closed on
Mar 7, 2000
Sold by
Killebrew L M
Bought by
Ray Shelby
Purchase Details
Closed on
Aug 19, 1998
Sold by
Phillips Ray and Phillips Caro
Bought by
Killebrew L M
Purchase Details
Closed on
Jan 18, 1985
Sold by
Williams Ray D
Bought by
Phillips Ray and Phillips Caro
Purchase Details
Closed on
May 4, 1978
Sold by
Kinett G T
Bought by
Williams Ray D
Create a Home Valuation Report for This Property
The Home Valuation Report is an in-depth analysis detailing your home's value as well as a comparison with similar homes in the area
Home Values in the Area
Average Home Value in this Area
Purchase History
| Date | Buyer | Sale Price | Title Company |
|---|---|---|---|
| Hooks Robert Joseph | $215,000 | -- | |
| Z3 Holdings Llc | -- | -- | |
| Mb One Capital Llc | -- | -- | |
| Mcleod Farms Llc | $225,000 | -- | |
| Ray Shelby | -- | -- | |
| Ray Shelby | $86,000 | -- | |
| Killebrew L M | $70,000 | -- | |
| Phillips Ray | -- | -- | |
| Williams Ray D | -- | -- |
Source: Public Records
Tax History Compared to Growth
Tax History
| Year | Tax Paid | Tax Assessment Tax Assessment Total Assessment is a certain percentage of the fair market value that is determined by local assessors to be the total taxable value of land and additions on the property. | Land | Improvement |
|---|---|---|---|---|
| 2024 | $3,948 | $119,088 | $45,920 | $73,168 |
| 2023 | $2,797 | $77,168 | $45,920 | $31,248 |
| 2022 | $2,628 | $71,568 | $45,920 | $25,648 |
| 2021 | $2,633 | $71,568 | $45,920 | $25,648 |
| 2020 | $2,675 | $70,488 | $45,920 | $24,568 |
| 2019 | $2,607 | $70,488 | $45,920 | $24,568 |
| 2018 | $2,607 | $70,488 | $45,920 | $24,568 |
| 2017 | $2,607 | $70,488 | $45,920 | $24,568 |
| 2016 | $2,627 | $71,072 | $45,920 | $25,152 |
| 2015 | -- | $66,632 | $37,760 | $28,872 |
| 2014 | $2,446 | $66,632 | $37,760 | $28,872 |
| 2013 | -- | $66,632 | $37,760 | $28,872 |
Source: Public Records
Map
Nearby Homes
- 170D Cantey Dr
- 152 Cantey Dr
- 151 Gary Brewer Rd
- 252 N Spring Creek Cir
- 108 N Spring Creek Cir
- 114 Water Front Rd
- 115 Cypress Ln
- 286 Cannon Branch Rd
- 0 N Spring Creek Cir
- 376 N Spring Creek Cir
- TBD N Spring Creek Cir
- 101 Rose Ln
- 100 Valhalla
- 244 Cannon Branch Rd
- 110 N Valhalla Ln Unit 5
- 110 N Valhalla Ln
- 115 N Valhalla Ln
- 117 N Valhalla Ln
- 154 Cannon Branch Rd
- Lot # 18 Cannon Branch Rd
- 211 Tommy Warren Dr
- 217 Tommy Warren Rd
- 205 Tommy Warren Dr
- 218 Tommy Warren Dr
- 220 Tommy Warren Dr
- 203 Tommy Warren Dr
- 124 Tom Hollomn Rd
- 195 Tommy Warren Dr
- 122 Tom Hollomn Rd
- 219C Tommy Warren Rd
- 219 Tommy Warren Dr
- 197 Tommy Warren Dr
- 120 Tom Hollomn Rd
- 118 Rd
- 193 Tommy Warren Dr
- 191 Tommy Warren Dr
- 110 Tom Hollomn Rd
- 189 Tommy Warren Dr
- 183 Tommy Warren Dr
- 180 Tommy Warren Dr