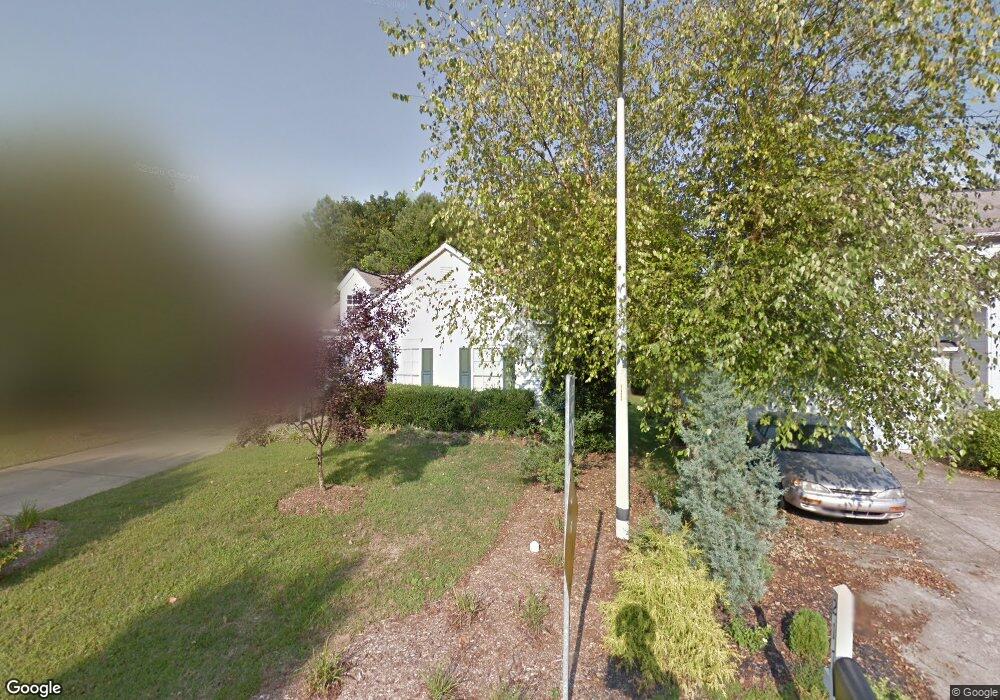
213 Tullich Way Holly Springs, NC 27540
Estimated Value: $378,404 - $404,000
3
Beds
2
Baths
1,440
Sq Ft
$269/Sq Ft
Est. Value
About This Home
This home is located at 213 Tullich Way, Holly Springs, NC 27540 and is currently estimated at $387,601, approximately $269 per square foot. 213 Tullich Way is a home located in Wake County with nearby schools including Oakview Elementary School, Apex Friendship Middle School, and Holly Springs High School.
Ownership History
Date
Name
Owned For
Owner Type
Purchase Details
Closed on
May 16, 2024
Sold by
Caul Matina and Caul Kevin
Bought by
Holly Springs Caul Property Management Ii Llc
Current Estimated Value
Purchase Details
Closed on
Oct 29, 2015
Sold by
Robbins Pollack Andrew and Robbins Pollack Lauren
Bought by
Caul Marina and Caul Kevin
Home Financials for this Owner
Home Financials are based on the most recent Mortgage that was taken out on this home.
Original Mortgage
$135,200
Interest Rate
3.17%
Mortgage Type
New Conventional
Purchase Details
Closed on
Dec 28, 1999
Sold by
Beazer Homes Corp
Bought by
Robbins Pollack Andrew and Robbins Pollack Lauren
Home Financials for this Owner
Home Financials are based on the most recent Mortgage that was taken out on this home.
Original Mortgage
$101,400
Interest Rate
7.68%
Purchase Details
Closed on
Jun 24, 1999
Sold by
Oakhall Ltd Partnership
Bought by
Beazer Homes Corp
Create a Home Valuation Report for This Property
The Home Valuation Report is an in-depth analysis detailing your home's value as well as a comparison with similar homes in the area
Home Values in the Area
Average Home Value in this Area
Purchase History
| Date | Buyer | Sale Price | Title Company |
|---|---|---|---|
| Holly Springs Caul Property Management Ii Llc | -- | None Listed On Document | |
| Caul Marina | $169,000 | Attorney | |
| Robbins Pollack Andrew | $139,500 | -- | |
| Beazer Homes Corp | $22,000 | -- |
Source: Public Records
Mortgage History
| Date | Status | Borrower | Loan Amount |
|---|---|---|---|
| Previous Owner | Caul Marina | $135,200 | |
| Previous Owner | Robbins Pollack Andrew | $101,400 |
Source: Public Records
Tax History Compared to Growth
Tax History
| Year | Tax Paid | Tax Assessment Tax Assessment Total Assessment is a certain percentage of the fair market value that is determined by local assessors to be the total taxable value of land and additions on the property. | Land | Improvement |
|---|---|---|---|---|
| 2025 | $3,163 | $365,266 | $115,000 | $250,266 |
| 2024 | $3,150 | $365,266 | $115,000 | $250,266 |
| 2023 | $2,597 | $238,878 | $50,000 | $188,878 |
| 2022 | $2,507 | $238,878 | $50,000 | $188,878 |
| 2021 | $2,460 | $238,878 | $50,000 | $188,878 |
| 2020 | $2,460 | $238,878 | $50,000 | $188,878 |
| 2019 | $2,295 | $189,089 | $50,000 | $139,089 |
| 2018 | $2,075 | $189,089 | $50,000 | $139,089 |
| 2017 | $2,001 | $189,089 | $50,000 | $139,089 |
| 2016 | $1,973 | $189,089 | $50,000 | $139,089 |
| 2015 | $1,782 | $167,846 | $35,000 | $132,846 |
| 2014 | -- | $167,846 | $35,000 | $132,846 |
Source: Public Records
Map
Nearby Homes
- 108 Crabwall Ct
- 225 Douglas St
- 124 Cliffdale Rd
- 737 W Holly Springs Rd
- 112 Burt St
- 743 W Holly Springs Rd
- 321 Blalock St
- 749 W Holly Springs Rd
- 105 Cross Hill Ln
- 755 W Holly Springs Rd
- 321 Cross Hill Ln
- 717 Starkland Way
- 761 W Holly Springs Rd
- 318 Blalock St
- 713 Littleleaf Ct
- 105 Townsgate Ct
- 405 W Ballentine St
- 224 Hartshorn Ct
- 109 Bright Shade Ct
- 104 Chilmark Ridge Dr
- 217 Tullich Way
- 205 Tullich Way
- 221 Tullich Way
- 316 Stone Hedge Ct
- 320 Stone Hedge Ct
- 312 Stone Hedge Ct
- 324 Stone Hedge Ct
- 308 Stone Hedge Ct
- 216 Tullich Way
- 225 Tullich Way
- 220 Tullich Way
- 201 Tullich Way
- 212 Tullich Way
- 224 Tullich Way
- 328 Stone Hedge Ct
- 105 Tullich Way
- 304 Stone Hedge Ct
- 208 Tullich Way
- 228 Tullich Way
- 332 Stone Hedge Ct