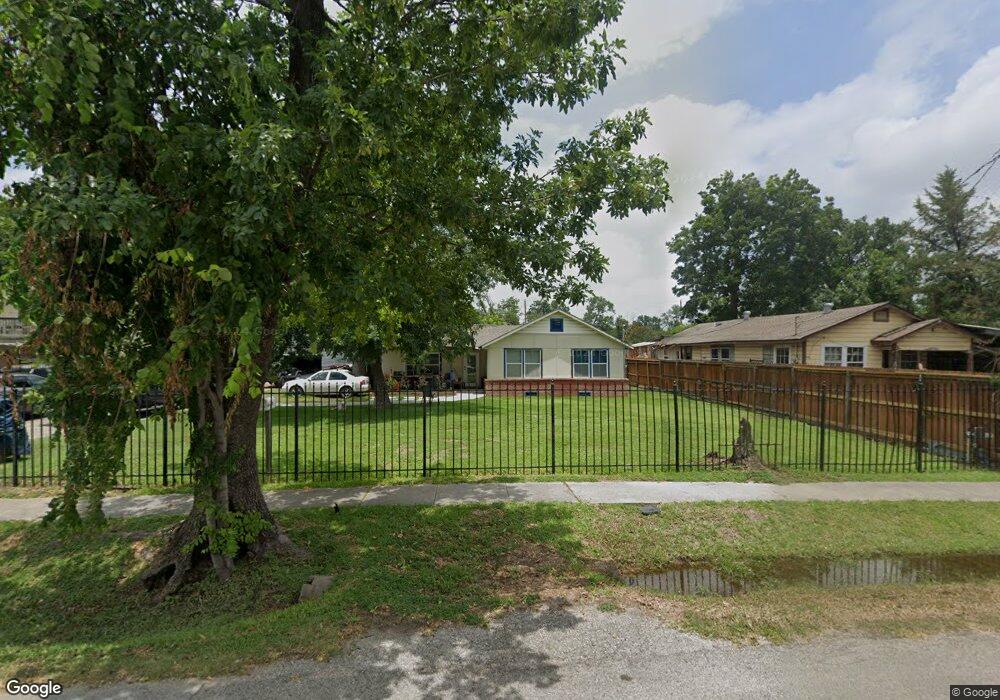
213 Van Molan St Houston, TX 77022
Northside-Northline NeighborhoodEstimated Value: $258,696 - $271,000
4
Beds
2
Baths
1,569
Sq Ft
$169/Sq Ft
Est. Value
About This Home
This home is located at 213 Van Molan St, Houston, TX 77022 and is currently estimated at $265,924, approximately $169 per square foot. 213 Van Molan St is a home located in Harris County with nearby schools including Janowski Elementary School, Burbank Middle School, and Sam Houston Math, Science & Technology Center.
Ownership History
Date
Name
Owned For
Owner Type
Purchase Details
Closed on
Nov 22, 2013
Sold by
Mendez John
Bought by
Hobbs Alma
Current Estimated Value
Home Financials for this Owner
Home Financials are based on the most recent Mortgage that was taken out on this home.
Original Mortgage
$125,000
Outstanding Balance
$93,624
Interest Rate
4.34%
Mortgage Type
Purchase Money Mortgage
Estimated Equity
$172,300
Purchase Details
Closed on
Sep 4, 2008
Sold by
Mendez John
Bought by
Metropolitan Transit Authority Of Harris
Purchase Details
Closed on
Jan 21, 1998
Sold by
Mendez Eva
Bought by
Mendez John
Create a Home Valuation Report for This Property
The Home Valuation Report is an in-depth analysis detailing your home's value as well as a comparison with similar homes in the area
Home Values in the Area
Average Home Value in this Area
Purchase History
| Date | Buyer | Sale Price | Title Company |
|---|---|---|---|
| Hobbs Alma | -- | Old Republic National Title | |
| Metropolitan Transit Authority Of Harris | -- | None Available | |
| Mendez John | -- | -- |
Source: Public Records
Mortgage History
| Date | Status | Borrower | Loan Amount |
|---|---|---|---|
| Open | Hobbs Alma | $125,000 | |
| Closed | Mendez John | $0 |
Source: Public Records
Tax History
| Year | Tax Paid | Tax Assessment Tax Assessment Total Assessment is a certain percentage of the fair market value that is determined by local assessors to be the total taxable value of land and additions on the property. | Land | Improvement |
|---|---|---|---|---|
| 2025 | $594 | $257,177 | $177,840 | $79,337 |
| 2024 | $594 | $241,151 | $163,215 | $77,936 |
| 2023 | $594 | $220,308 | $99,450 | $120,858 |
| 2022 | $3,671 | $194,319 | $99,450 | $94,869 |
| 2021 | $3,532 | $170,689 | $99,450 | $71,239 |
| 2020 | $3,337 | $161,711 | $99,450 | $62,261 |
| 2019 | $3,170 | $147,736 | $81,900 | $65,836 |
| 2018 | $2,015 | $121,403 | $68,445 | $52,958 |
| 2017 | $2,618 | $121,403 | $68,445 | $52,958 |
| 2016 | $2,380 | $116,088 | $64,350 | $51,738 |
| 2015 | $1,589 | $85,556 | $36,800 | $48,756 |
| 2014 | $1,589 | $85,556 | $36,800 | $48,756 |
Source: Public Records
Map
Nearby Homes
- 245 Palmyra St
- 7820 Fulton St
- 0 Yorkshire St Unit 22534906
- 0 E 31st St Unit 75519178
- 0 W Hardy St Unit 97848877
- 0 W Hardy St Unit 80694202
- 3111 Eastman St
- 246 Rebecca St
- 7523 Roswell St
- 243 Rebecca St Unit F
- 243 Rebecca St Unit E
- 7805 Farnsworth St Unit A/B
- 241 Rebecca St Unit B
- 241 Rebecca St Unit A
- 241 Rebecca St Unit A/B
- 7125 Farnsworth St
- 428 Van Molan St
- 64 Neyland St
- 206 Oddo St
- 120 Westfield St
- 215 Van Molan St
- 139 Van Molan St
- 139 Van Molan St Unit B
- 137 Van Molan St
- 217 Van Molan St
- 212 Palmyra St
- 214 Palmyra St
- 210 Palmyra St
- 133 Van Molan St
- 220 Palmyra St
- 208 Palmyra St
- 212 Van Molan St
- 210 Van Molan St
- 227 Van Molan St
- 218 Van Molan St
- 224 Palmyra St
- 125 Van Molan St
- 220 Van Molan St
- 204 Palmyra St
- 228 Palmyra St
Your Personal Tour Guide
Ask me questions while you tour the home.