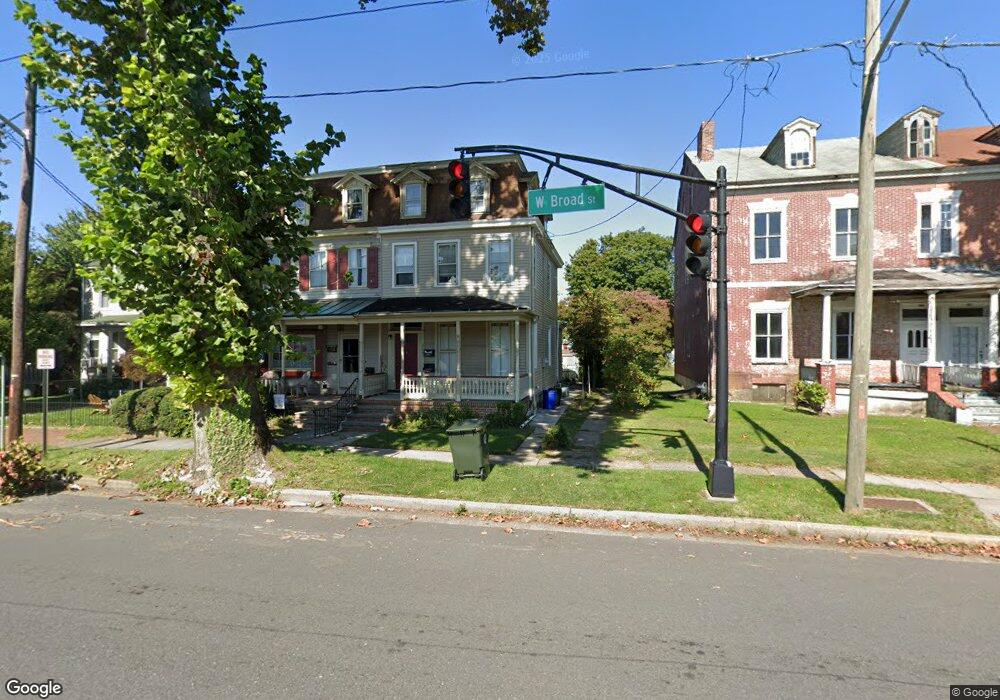
213 W Broad St Burlington, NJ 08016
Estimated Value: $254,511 - $332,000
2
Beds
1
Bath
2,272
Sq Ft
$123/Sq Ft
Est. Value
About This Home
This home is located at 213 W Broad St, Burlington, NJ 08016 and is currently estimated at $279,128, approximately $122 per square foot. 213 W Broad St is a home located in Burlington County with nearby schools including Burlington City High School, Doane Academy, and St Paul's Parochial School.
Ownership History
Date
Name
Owned For
Owner Type
Purchase Details
Closed on
Mar 31, 2020
Sold by
John J Ferry Enterprises
Bought by
Sps Holdings Llc
Current Estimated Value
Home Financials for this Owner
Home Financials are based on the most recent Mortgage that was taken out on this home.
Original Mortgage
$140,000
Interest Rate
3.3%
Mortgage Type
Unknown
Purchase Details
Closed on
Jul 28, 2015
Sold by
Crestar Homes Llc
Bought by
Jpaul Homes Llc
Purchase Details
Closed on
Dec 19, 1978
Bought by
John J Ferry Enterprises, Inc
Create a Home Valuation Report for This Property
The Home Valuation Report is an in-depth analysis detailing your home's value as well as a comparison with similar homes in the area
Home Values in the Area
Average Home Value in this Area
Purchase History
| Date | Buyer | Sale Price | Title Company |
|---|---|---|---|
| Sps Holdings Llc | $140,000 | S And H Abstract Co | |
| Jpaul Homes Llc | $39,100 | First National Title | |
| John J Ferry Enterprises, Inc | $38,000 | -- |
Source: Public Records
Mortgage History
| Date | Status | Borrower | Loan Amount |
|---|---|---|---|
| Previous Owner | Sps Holdings Llc | $140,000 |
Source: Public Records
Tax History Compared to Growth
Tax History
| Year | Tax Paid | Tax Assessment Tax Assessment Total Assessment is a certain percentage of the fair market value that is determined by local assessors to be the total taxable value of land and additions on the property. | Land | Improvement |
|---|---|---|---|---|
| 2025 | $6,815 | $157,400 | $31,200 | $126,200 |
| 2024 | $6,696 | $157,400 | $31,200 | $126,200 |
| 2023 | $6,696 | $157,400 | $31,200 | $126,200 |
| 2022 | $6,622 | $157,400 | $31,200 | $126,200 |
| 2021 | $6,526 | $157,400 | $31,200 | $126,200 |
| 2020 | $6,293 | $157,400 | $31,200 | $126,200 |
| 2019 | $6,002 | $157,400 | $31,200 | $126,200 |
| 2018 | $5,899 | $157,400 | $31,200 | $126,200 |
| 2017 | $5,718 | $157,400 | $31,200 | $126,200 |
| 2016 | $5,503 | $157,400 | $31,200 | $126,200 |
| 2015 | $5,306 | $157,400 | $31,200 | $126,200 |
| 2014 | $5,131 | $157,400 | $31,200 | $126,200 |
Source: Public Records
Map
Nearby Homes