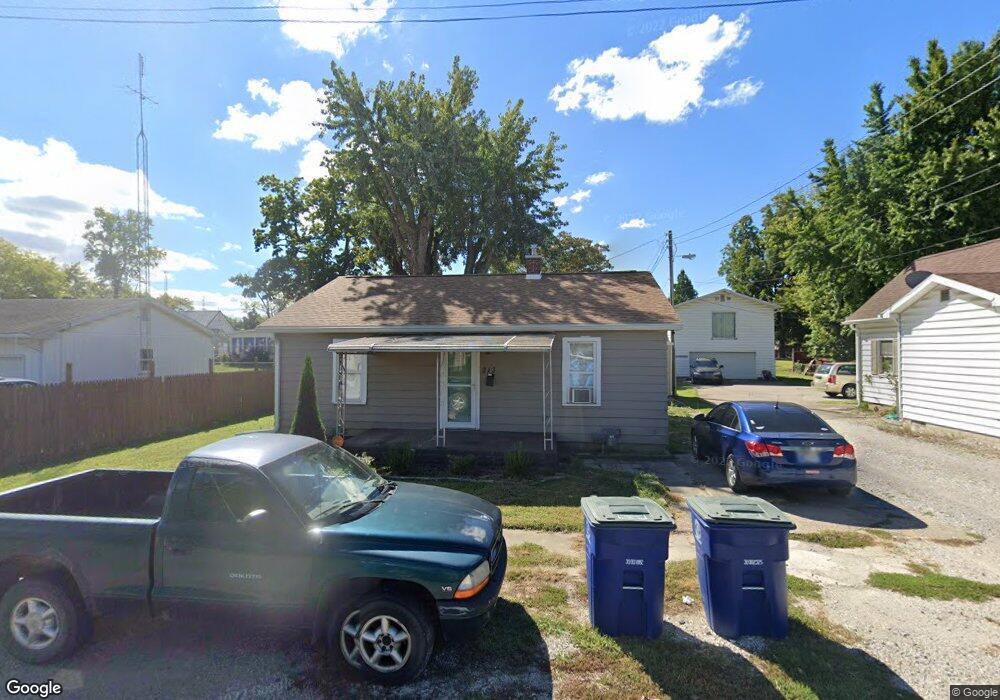
213 W Mulberry St Princeton, IN 47670
Estimated Value: $91,473 - $130,000
3
Beds
1
Bath
1,972
Sq Ft
$59/Sq Ft
Est. Value
About This Home
This home is located at 213 W Mulberry St, Princeton, IN 47670 and is currently estimated at $117,118, approximately $59 per square foot. 213 W Mulberry St is a home located in Gibson County with nearby schools including Princeton Community Intermediate School, Princeton Community Primary School, and Princeton Community Middle School.
Ownership History
Date
Name
Owned For
Owner Type
Purchase Details
Closed on
Dec 30, 2024
Sold by
Sheren Renee
Bought by
Kays Jayden and Kays Jessica
Current Estimated Value
Home Financials for this Owner
Home Financials are based on the most recent Mortgage that was taken out on this home.
Original Mortgage
$6,600
Outstanding Balance
$6,572
Interest Rate
6.84%
Estimated Equity
$110,546
Purchase Details
Closed on
Mar 5, 2020
Sold by
Weber Investments Llc
Bought by
Sheren Renee
Purchase Details
Closed on
May 21, 2012
Sold by
Windgate Properties Llc
Bought by
Weber Investments Llc
Purchase Details
Closed on
May 11, 2012
Sold by
Montgomery C T
Bought by
Windgate Properties Llc
Create a Home Valuation Report for This Property
The Home Valuation Report is an in-depth analysis detailing your home's value as well as a comparison with similar homes in the area
Home Values in the Area
Average Home Value in this Area
Purchase History
| Date | Buyer | Sale Price | Title Company |
|---|---|---|---|
| Kays Jayden | -- | None Listed On Document | |
| Sheren Renee | -- | None Available | |
| Weber Investments Llc | $8,000 | Law Offices Of Wayne Greeson | |
| Weber Investments Llc | $8,000 | Law Offices Of Wayne Greeson P | |
| Windgate Properties Llc | $1,071 | Law Offices Of Wayne Greeson | |
| Windgate Properties Llc | $1,100 | Law Offices Of Wayne Greeson P |
Source: Public Records
Mortgage History
| Date | Status | Borrower | Loan Amount |
|---|---|---|---|
| Open | Kays Jayden | $6,600 | |
| Open | Kays Jayden | $108,007 | |
| Closed | Kays Jessica | $6,600 |
Source: Public Records
Tax History Compared to Growth
Tax History
| Year | Tax Paid | Tax Assessment Tax Assessment Total Assessment is a certain percentage of the fair market value that is determined by local assessors to be the total taxable value of land and additions on the property. | Land | Improvement |
|---|---|---|---|---|
| 2024 | $607 | $70,700 | $3,900 | $66,800 |
| 2023 | $677 | $76,000 | $3,900 | $72,100 |
| 2022 | $546 | $70,100 | $3,900 | $66,200 |
| 2021 | $58 | $17,300 | $3,900 | $13,400 |
| 2020 | $49 | $14,600 | $3,900 | $10,700 |
| 2019 | $296 | $13,900 | $3,900 | $10,000 |
| 2018 | $278 | $13,900 | $3,900 | $10,000 |
| 2017 | $540 | $27,000 | $3,900 | $23,100 |
| 2016 | $540 | $27,000 | $3,900 | $23,100 |
| 2014 | $614 | $30,700 | $3,900 | $26,800 |
| 2013 | -- | $31,000 | $3,900 | $27,100 |
Source: Public Records
Map
Nearby Homes
- 515 S Main St
- 319 W Monroe St
- 601 S Gibson St
- 310 S Hart St
- 301 E Monroe St
- 506 W Monroe St
- 904 Virgil Blvd
- 403 E Illinois St
- 522 S Race St
- 2909 Indiana 64
- 827 S Stormont St
- 1101 Virgil Blvd
- 421 S Spring St
- 730 S Stormont St
- 820 S Stormont St
- 208 S Race St
- 1218 Mckinley St
- 309 S Stout St
- 902 W Broadway St
- 520 W Emerson St
- 225 W Mulberry St
- 201 W Mulberry St
- 713 S Hart St
- 212 W Mulberry St
- 229 W Mulberry St
- 717 S Hart St
- 621 S Hart St
- 224 W Mulberry St
- 719 S Hart St
- 125 W Mulberry St
- 710 S Hart St
- 619 S Hart St
- 720 S Hart St
- 724 S Hart St
- 123 W Mulberry St
- 726 S Hart St
- 630 S Hart St
- 302 W Mulberry St
- 611 S Hart St
- 121 W Mulberry St