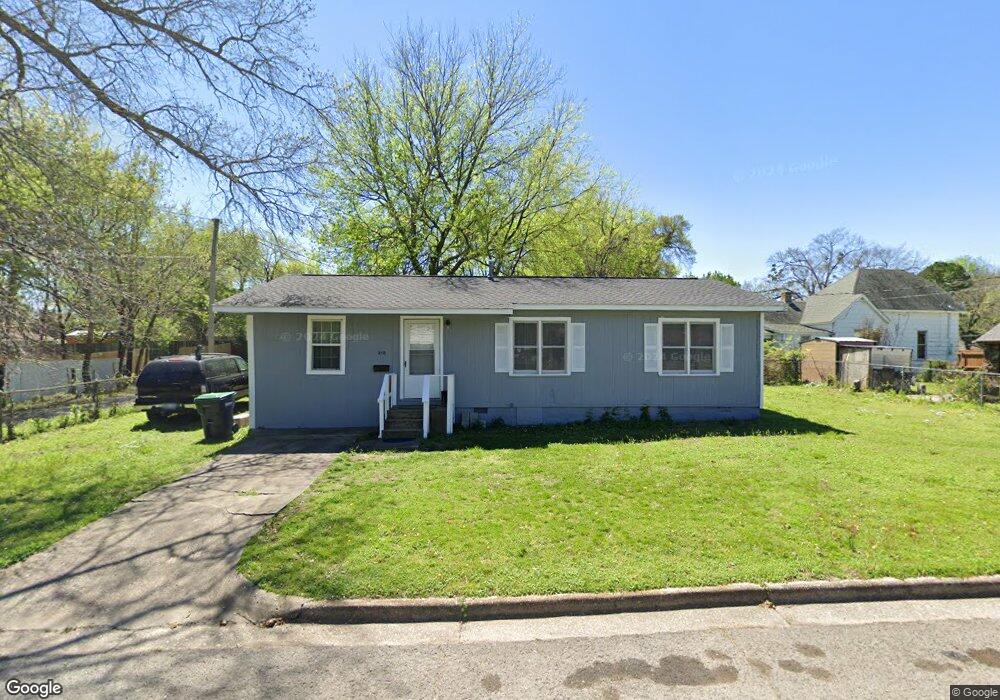
213 W Ross St Tahlequah, OK 74464
Estimated Value: $58,000 - $104,174
2
Beds
1
Bath
768
Sq Ft
$116/Sq Ft
Est. Value
About This Home
This home is located at 213 W Ross St, Tahlequah, OK 74464 and is currently estimated at $88,794, approximately $115 per square foot. 213 W Ross St is a home located in Cherokee County with nearby schools including Greenwood Elementary School, Cherokee Elementary School, and Tahlequah Middle School.
Ownership History
Date
Name
Owned For
Owner Type
Purchase Details
Closed on
Apr 30, 2021
Sold by
Ratliff Brandon
Bought by
Ratliff Brian K and Ratliff Janice M
Current Estimated Value
Home Financials for this Owner
Home Financials are based on the most recent Mortgage that was taken out on this home.
Original Mortgage
$51,435
Interest Rate
3%
Mortgage Type
Credit Line Revolving
Purchase Details
Closed on
Nov 6, 2013
Sold by
Ratliff Brandon and Ratliff Megan
Bought by
Ratliff Brandon
Home Financials for this Owner
Home Financials are based on the most recent Mortgage that was taken out on this home.
Original Mortgage
$54,480
Interest Rate
4.28%
Mortgage Type
New Conventional
Purchase Details
Closed on
Apr 16, 2010
Sold by
Thomas Joseph Richard and Thomas Robin
Bought by
Ratliff Brandon and Ratliff Megan
Home Financials for this Owner
Home Financials are based on the most recent Mortgage that was taken out on this home.
Original Mortgage
$49,000
Interest Rate
4.91%
Mortgage Type
New Conventional
Create a Home Valuation Report for This Property
The Home Valuation Report is an in-depth analysis detailing your home's value as well as a comparison with similar homes in the area
Home Values in the Area
Average Home Value in this Area
Purchase History
| Date | Buyer | Sale Price | Title Company |
|---|---|---|---|
| Ratliff Brian K | $47,000 | Infinity Title Llc | |
| Ratliff Brandon | -- | None Available | |
| Ratliff Brandon | $43,000 | Heritage Title |
Source: Public Records
Mortgage History
| Date | Status | Borrower | Loan Amount |
|---|---|---|---|
| Closed | Ratliff Brian K | $51,435 | |
| Previous Owner | Ratliff Brandon | $54,480 | |
| Previous Owner | Ratliff Brandon | $49,000 |
Source: Public Records
Tax History Compared to Growth
Tax History
| Year | Tax Paid | Tax Assessment Tax Assessment Total Assessment is a certain percentage of the fair market value that is determined by local assessors to be the total taxable value of land and additions on the property. | Land | Improvement |
|---|---|---|---|---|
| 2025 | $496 | $5,498 | $1,607 | $3,891 |
| 2024 | $496 | $5,236 | $1,150 | $4,086 |
| 2023 | $496 | $4,987 | $517 | $4,470 |
| 2022 | $441 | $4,749 | $517 | $4,232 |
| 2021 | $421 | $4,523 | $517 | $4,006 |
| 2020 | $408 | $4,308 | $517 | $3,791 |
| 2019 | $385 | $4,102 | $517 | $3,585 |
| 2018 | $371 | $3,907 | $517 | $3,390 |
| 2017 | $371 | $3,907 | $517 | $3,390 |
| 2016 | $373 | $3,907 | $517 | $3,390 |
| 2015 | $445 | $3,746 | $517 | $3,229 |
| 2014 | $445 | $4,730 | $367 | $4,363 |
Source: Public Records
Map
Nearby Homes
- 510 S Cherokee Ave
- 528 S Muskogee Ave
- 513 S State Ave
- 224 W Chickasaw St
- 802 S College Ave
- 516 W Fox St
- 821 S College Ave
- 757 S Bluff Ave
- 306 Short St
- 201 Sandy Cir
- 403 S Bluff Ave
- 515 W Delaware St
- 0 W Choctaw St
- 321 W Shawnee St
- 902 S Mission Ave
- 610 W Delaware St
- 215 S Maple Ave
- 807 W Choctaw St
- 905 Shelley Cir
- 413 Greenwood Dr
- 218 W Ross St
- 214 W Ross St
- 502 S College Ave
- 511 S Cherokee Ave
- 501 S Cherokee Ave
- 314 W Ross St
- 503 S Cherokee Ave
- 505 S Cherokee Ave
- 514 S College Ave
- 507 S Cherokee Ave
- 507 S Cherokee Ave
- 520 S College Ave
- 522 S College Ave
- 322 W Ross St
- 308 W Ross St
- 508 S Cherokee Ave
- 315 W Ross St
- 327 W Ross St
- 534 S College Ave
- 501 S College Ave