213 Windmark Way Unit Lot 42 Port St. Joe, FL 32456
Estimated Value: $836,000 - $1,248,000
4
Beds
3
Baths
1,899
Sq Ft
$544/Sq Ft
Est. Value
About This Home
This home is located at 213 Windmark Way Unit Lot 42, Port St. Joe, FL 32456 and is currently estimated at $1,033,751, approximately $544 per square foot. 213 Windmark Way Unit Lot 42 is a home located in Gulf County with nearby schools including Growing Minds Center.
Ownership History
Date
Name
Owned For
Owner Type
Purchase Details
Closed on
Aug 30, 2021
Sold by
Page Robert Lee and The Robert Lee Page Trust
Bought by
Rivera Grant and Rivera Jennifer
Current Estimated Value
Home Financials for this Owner
Home Financials are based on the most recent Mortgage that was taken out on this home.
Original Mortgage
$547,250
Outstanding Balance
$493,903
Interest Rate
2.7%
Mortgage Type
New Conventional
Estimated Equity
$539,848
Purchase Details
Closed on
Dec 8, 2016
Sold by
North Thomas J and North Ruth H
Bought by
Page Robert L
Home Financials for this Owner
Home Financials are based on the most recent Mortgage that was taken out on this home.
Original Mortgage
$417,000
Interest Rate
3.47%
Mortgage Type
New Conventional
Purchase Details
Closed on
May 18, 2011
Sold by
Levitz Gary S and Levitz Randi S
Bought by
North Thomas J and North Ruth H
Create a Home Valuation Report for This Property
The Home Valuation Report is an in-depth analysis detailing your home's value as well as a comparison with similar homes in the area
Home Values in the Area
Average Home Value in this Area
Purchase History
| Date | Buyer | Sale Price | Title Company |
|---|---|---|---|
| Rivera Grant | $927,000 | Attorney | |
| Page Robert L | $575,000 | None Available | |
| North Thomas J | $110,000 | Attorney |
Source: Public Records
Mortgage History
| Date | Status | Borrower | Loan Amount |
|---|---|---|---|
| Open | Rivera Grant | $547,250 | |
| Previous Owner | Page Robert L | $417,000 |
Source: Public Records
Tax History Compared to Growth
Tax History
| Year | Tax Paid | Tax Assessment Tax Assessment Total Assessment is a certain percentage of the fair market value that is determined by local assessors to be the total taxable value of land and additions on the property. | Land | Improvement |
|---|---|---|---|---|
| 2025 | $8,538 | $746,114 | $240,000 | $506,114 |
| 2024 | $8,434 | $714,146 | $200,000 | $514,146 |
| 2023 | $8,244 | $662,123 | $140,000 | $522,123 |
| 2022 | $9,014 | $698,234 | $180,000 | $518,234 |
| 2021 | $5,872 | $459,573 | $103,500 | $356,073 |
| 2020 | $5,701 | $454,094 | $92,000 | $362,094 |
| 2019 | $4,790 | $340,389 | $73,000 | $267,389 |
| 2018 | $6,628 | $464,173 | $0 | $0 |
| 2017 | $6,946 | $485,232 | $0 | $0 |
| 2016 | $4,322 | $333,837 | $0 | $0 |
| 2015 | $4,401 | $331,516 | $0 | $0 |
| 2014 | $4,147 | $331,516 | $0 | $0 |
Source: Public Records
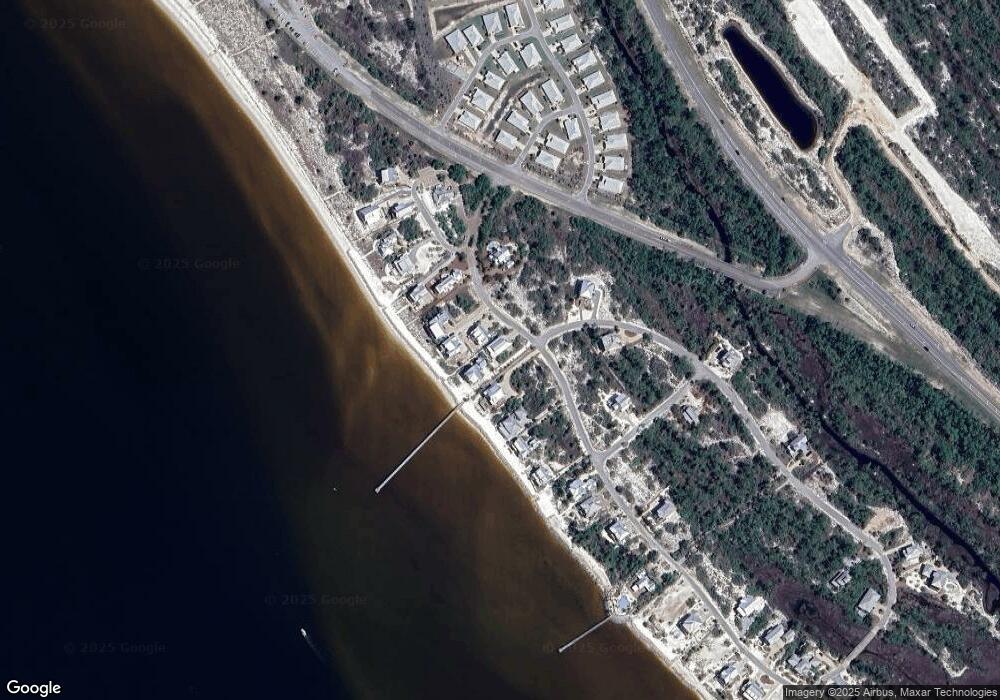
Map
Nearby Homes
- 303 Windmark Way
- 205 Signal Ln
- 126 Tide Water Dr
- 130 Falling Star Way
- 110 Falling Star Way
- 214 Signal Ln
- 295 Watermark Way
- 436 Windmark Way
- 118 Blue Sky Way
- 502 Windmark Way
- 510 Windmark Way
- 502 Tide Water Dr
- 504 Tide Water Dr
- 528 Windmark Way
- 102 Goldfish Ct
- 508 Tide Water Dr
- 604 Tide Water Dr
- 606 Tide Water Dr
- 104 Pinwheel Ct
- 3050 W Highway 98 Unit D122
- 213 Windmark Way Unit Windmark Ph 1
- 213 Windmark Way
- 211 Windmark Way
- 303 Windmark Way Unit Lot 43
- 215 Windmark Way
- 315 Windmark Way
- 209 Windmark Way Unit Lot 7
- 209 Windmark Way
- 244 Windmark Way
- 212 Windmark Way Unit Lot 67
- 212 Windmark Way
- 205 Windmark Way Unit Lot 40
- 205 Windmark Way
- 305 Windmark Way
- 207 Windmark Way
- 307 Windmark Way
- 302 Windmark Way Unit Lot 71
- 302 Windmark Way
- 71 Windmark Way
- 206 Windmark Way