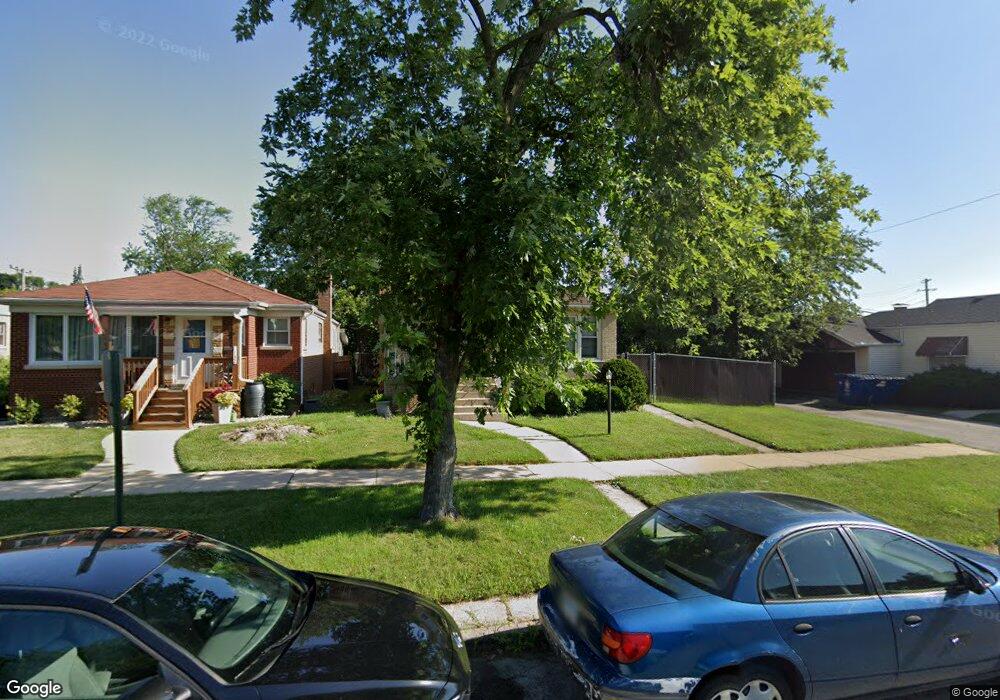
2130 121st Place Blue Island, IL 60406
Estimated Value: $174,000 - $217,000
3
Beds
1
Bath
1,227
Sq Ft
$159/Sq Ft
Est. Value
About This Home
This home is located at 2130 121st Place, Blue Island, IL 60406 and is currently estimated at $195,397, approximately $159 per square foot. 2130 121st Place is a home located in Cook County with nearby schools including Paul Revere Intermediate School, Paul Revere Primary School, and Veterans Memorial Middle School.
Ownership History
Date
Name
Owned For
Owner Type
Purchase Details
Closed on
Dec 26, 2003
Sold by
Gonzalez Iran and Hernandez Esteban
Bought by
Gonzalez Iran
Current Estimated Value
Home Financials for this Owner
Home Financials are based on the most recent Mortgage that was taken out on this home.
Original Mortgage
$125,500
Interest Rate
6.08%
Mortgage Type
New Conventional
Purchase Details
Closed on
Apr 25, 2002
Sold by
Standard Bank & Trust Company
Bought by
Gonzalez Iran and Hernandez Esteban
Home Financials for this Owner
Home Financials are based on the most recent Mortgage that was taken out on this home.
Original Mortgage
$123,322
Interest Rate
7.24%
Mortgage Type
FHA
Purchase Details
Closed on
Oct 4, 2001
Sold by
Logan
Bought by
Baldinelli Donald B
Purchase Details
Closed on
Sep 14, 2001
Sold by
Bell Willena
Bought by
Logan Gerald
Create a Home Valuation Report for This Property
The Home Valuation Report is an in-depth analysis detailing your home's value as well as a comparison with similar homes in the area
Home Values in the Area
Average Home Value in this Area
Purchase History
| Date | Buyer | Sale Price | Title Company |
|---|---|---|---|
| Gonzalez Iran | -- | Multiple | |
| Gonzalez Iran | $135,000 | -- | |
| Baldinelli Donald B | $44,500 | -- | |
| Logan Gerald | -- | -- |
Source: Public Records
Mortgage History
| Date | Status | Borrower | Loan Amount |
|---|---|---|---|
| Closed | Gonzalez Iran | $125,500 | |
| Closed | Gonzalez Iran | $123,322 |
Source: Public Records
Tax History Compared to Growth
Tax History
| Year | Tax Paid | Tax Assessment Tax Assessment Total Assessment is a certain percentage of the fair market value that is determined by local assessors to be the total taxable value of land and additions on the property. | Land | Improvement |
|---|---|---|---|---|
| 2024 | $1,964 | $5,827 | $2,271 | $3,556 |
| 2023 | $1,299 | $5,827 | $2,271 | $3,556 |
| 2022 | $1,299 | $3,631 | $1,987 | $1,644 |
| 2021 | $1,237 | $3,631 | $1,987 | $1,644 |
| 2020 | $1,233 | $3,631 | $1,987 | $1,644 |
| 2019 | $1,264 | $3,726 | $1,797 | $1,929 |
| 2018 | $1,540 | $4,469 | $1,797 | $2,672 |
| 2017 | $1,562 | $4,469 | $1,797 | $2,672 |
| 2016 | $1,528 | $3,982 | $1,608 | $2,374 |
| 2015 | $1,466 | $3,982 | $1,608 | $2,374 |
| 2014 | $1,445 | $3,982 | $1,608 | $2,374 |
| 2013 | $1,681 | $4,818 | $1,608 | $3,210 |
Source: Public Records
Map
Nearby Homes
- 2203 120th Place
- 12217 Longwood Dr
- 2330 121st St
- 2212 123rd Place
- 11836 S Hale Ave
- 2209 123rd Place
- 11815 S Hale Ave
- 11846 S Vincennes Ave
- 12045 Greenwood Ave
- 11811 S Vincennes Ave
- 12412 S Lincoln St
- 11761 S Vincennes Ave
- 12411 S Lincoln St
- 12510 Vincennes Rd
- 12500 S Lincoln St
- 11834 S Campbell Ave
- 12565 Irving Ave
- 11706 S Watkins Ave
- 11900 Ann St
- 15410 S Marshfield Ave
- 2130 121st Place
- 2132 121st Place
- 12126 Vincennes Rd
- 2136 121st Place
- 2123 121st St
- 2127 121st St
- 2115 121st St
- 12107 Longwood Dr
- 2111 121st St
- 2107 121st St
- 2135 121st Place
- 12126 Longwood Dr
- 12126 Longwood Dr
- 2101 121st St
- 12150 Vincennes Rd
- 2143 121st St
- 2154 121st Place
- 2147 121st Place
- 2147 121st Place