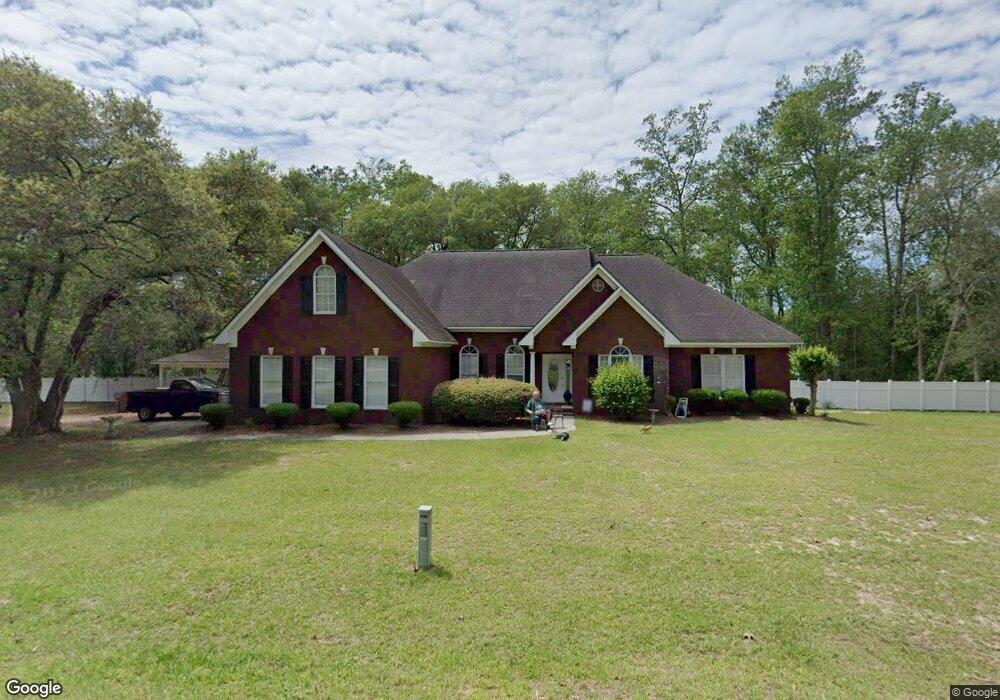
2130 Deer Run Cir Tifton, GA 31793
Estimated Value: $315,000 - $363,000
4
Beds
3
Baths
2,781
Sq Ft
$123/Sq Ft
Est. Value
About This Home
This home is located at 2130 Deer Run Cir, Tifton, GA 31793 and is currently estimated at $341,113, approximately $122 per square foot. 2130 Deer Run Cir is a home located in Tift County with nearby schools including Matt Wilson Elementary School, Annie Belle Clark Primary School, and J.T. Reddick School.
Ownership History
Date
Name
Owned For
Owner Type
Purchase Details
Closed on
Feb 5, 2016
Sold by
Shah Amiben S
Bought by
Cravey Antonia L and Lamberth Joseph A
Current Estimated Value
Home Financials for this Owner
Home Financials are based on the most recent Mortgage that was taken out on this home.
Original Mortgage
$110,000
Outstanding Balance
$87,747
Interest Rate
3.97%
Mortgage Type
New Conventional
Estimated Equity
$253,366
Purchase Details
Closed on
Mar 10, 2010
Sold by
Mcmillan Calvin L
Bought by
Shah Amiben S
Home Financials for this Owner
Home Financials are based on the most recent Mortgage that was taken out on this home.
Original Mortgage
$227,551
Interest Rate
4.93%
Mortgage Type
New Conventional
Purchase Details
Closed on
Apr 15, 1998
Bought by
Mcmillan Calvin L
Purchase Details
Closed on
Mar 2, 1994
Bought by
Flach Brian K
Purchase Details
Closed on
Sep 16, 1993
Bought by
Hulsey James Charles
Purchase Details
Closed on
Dec 20, 1991
Bought by
Flach Brian K
Create a Home Valuation Report for This Property
The Home Valuation Report is an in-depth analysis detailing your home's value as well as a comparison with similar homes in the area
Home Values in the Area
Average Home Value in this Area
Purchase History
| Date | Buyer | Sale Price | Title Company |
|---|---|---|---|
| Cravey Antonia L | $222,000 | -- | |
| Shah Amiben S | $219,000 | -- | |
| Mcmillan Calvin L | $17,000 | -- | |
| Flach Brian K | -- | -- | |
| Hulsey James Charles | $20,000 | -- | |
| Flach Brian K | $88,400 | -- |
Source: Public Records
Mortgage History
| Date | Status | Borrower | Loan Amount |
|---|---|---|---|
| Open | Cravey Antonia L | $110,000 | |
| Previous Owner | Shah Amiben S | $227,551 |
Source: Public Records
Tax History Compared to Growth
Tax History
| Year | Tax Paid | Tax Assessment Tax Assessment Total Assessment is a certain percentage of the fair market value that is determined by local assessors to be the total taxable value of land and additions on the property. | Land | Improvement |
|---|---|---|---|---|
| 2024 | $458 | $131,015 | $17,720 | $113,295 |
| 2023 | $332 | $89,243 | $8,500 | $80,743 |
| 2022 | $203 | $89,243 | $8,500 | $80,743 |
| 2021 | $199 | $89,243 | $8,500 | $80,743 |
| 2020 | $196 | $89,243 | $8,500 | $80,743 |
| 2019 | $298 | $89,243 | $8,500 | $80,743 |
| 2018 | $442 | $89,243 | $8,500 | $80,743 |
| 2017 | $546 | $89,243 | $8,500 | $80,743 |
| 2016 | $2,920 | $89,243 | $8,500 | $80,743 |
| 2015 | $2,918 | $89,243 | $8,500 | $80,743 |
| 2014 | $2,920 | $89,243 | $8,500 | $80,743 |
| 2013 | -- | $89,242 | $8,500 | $80,742 |
Source: Public Records
Map
Nearby Homes
- 4502 Carpenter Rd S
- 4554 Carpenter Rd S
- 54 Jacks Way
- 4104 London Ln
- 1802 Golden Rd W
- 27 Water's Edge Way
- 53 Waters Edge Way
- 17 Waters Edge Way
- 33 Surrey Cir
- 45 Surrey Cir
- 2706 Marshall Dr
- 58 Willow Creek Dr
- 64 Palmetta Rd
- 0 Jordan Rd
- 100 Palmetta Rd
- 604 Golden Rd W
- 0 S Carpenter Rd
- 171 Ellis Bryan Rd
- 4480 Union Rd
- 0 Union Rd
- 2129 Deer Run Cir
- 2126 Deer Run Cir
- 2125 Deer Run Cir
- 2124 Deer Run Cir
- 4510 Lee Anne Dr
- 4508 Lee Anne Dr
- 2123 Deer Run Cir
- 2122 Deer Run Cir
- 2136 Deer Run Cir
- 4506 Lee Anne Dr
- 4509 Lee Anne Dr
- 2138 Deer Run Cir
- 2121 Deer Run Cir
- 2120 Deer Run Cir
- 4507 Lee Anne Dr
- 4504 Lee Anne Dr
- 4505 Lee Anne Dr
- 2118 Deer Run Cir
- 4512 Raywood Dr
- 2140 Deer Run Cir