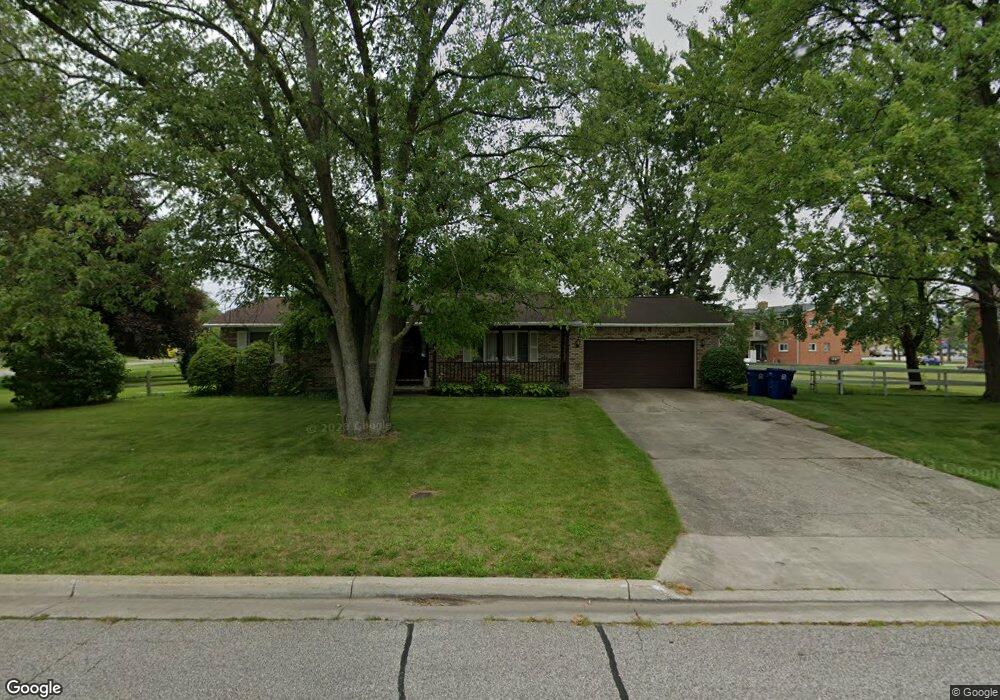
2130 Fabian Dr Saginaw, MI 48603
Estimated Value: $181,000 - $200,000
3
Beds
2
Baths
1,400
Sq Ft
$137/Sq Ft
Est. Value
About This Home
This home is located at 2130 Fabian Dr, Saginaw, MI 48603 and is currently estimated at $191,534, approximately $136 per square foot. 2130 Fabian Dr is a home located in Saginaw County with nearby schools including Weiss Elementary School, Sherwood Elementary School, and White Pine Middle School.
Ownership History
Date
Name
Owned For
Owner Type
Purchase Details
Closed on
May 21, 2024
Sold by
Bernard A And Mariann A Kruszka Trust and Kruszka Bernard A
Bought by
Kruszka Bernard A
Current Estimated Value
Purchase Details
Closed on
Sep 24, 2003
Sold by
Kruszka Bernard A and Kruszka Mariann A
Bought by
Kruszka Bernard A and Kruszka Mariann A
Purchase Details
Closed on
Jul 31, 2003
Sold by
Kruszka B A and M A
Bought by
Kruszka B A & M A Trust
Purchase Details
Closed on
Jun 6, 2003
Sold by
Osgood R A and C A
Bought by
Kruszka B A and M A
Purchase Details
Closed on
Jul 30, 1999
Sold by
Turner Mark A and Turner Theresa A
Bought by
Osgood Richard G and Osgood Carol A
Home Financials for this Owner
Home Financials are based on the most recent Mortgage that was taken out on this home.
Original Mortgage
$84,900
Interest Rate
7.37%
Create a Home Valuation Report for This Property
The Home Valuation Report is an in-depth analysis detailing your home's value as well as a comparison with similar homes in the area
Home Values in the Area
Average Home Value in this Area
Purchase History
| Date | Buyer | Sale Price | Title Company |
|---|---|---|---|
| Kruszka Bernard A | -- | None Listed On Document | |
| Kruszka Bernard A | -- | None Listed On Document | |
| Bernard A Kruszka Trust | -- | None Listed On Document | |
| Kruszka Bernard A | -- | -- | |
| Kruszka B A & M A Trust | -- | -- | |
| Kruszka B A | $115,100 | -- | |
| Kruszka Bernard A | $115,111 | Metro Saginaw | |
| Osgood Richard G | $99,900 | -- |
Source: Public Records
Mortgage History
| Date | Status | Borrower | Loan Amount |
|---|---|---|---|
| Previous Owner | Osgood Richard G | $84,900 |
Source: Public Records
Tax History Compared to Growth
Tax History
| Year | Tax Paid | Tax Assessment Tax Assessment Total Assessment is a certain percentage of the fair market value that is determined by local assessors to be the total taxable value of land and additions on the property. | Land | Improvement |
|---|---|---|---|---|
| 2025 | $2,334 | $84,000 | $0 | $0 |
| 2024 | $1,181 | $68,300 | $0 | $0 |
| 2023 | $1,124 | $64,300 | $0 | $0 |
| 2022 | $2,023 | $58,100 | $0 | $0 |
| 2021 | $1,870 | $52,000 | $0 | $0 |
| 2020 | $1,823 | $51,300 | $0 | $0 |
| 2019 | $1,744 | $51,700 | $9,400 | $42,300 |
| 2018 | $834 | $47,100 | $0 | $0 |
| 2017 | $1,544 | $45,200 | $0 | $0 |
| 2016 | $1,551 | $45,900 | $0 | $0 |
| 2014 | $2,004 | $47,900 | $0 | $38,300 |
| 2013 | -- | $48,900 | $0 | $0 |
Source: Public Records
Map
Nearby Homes
- 5568 Mary Ct
- 5475 George St
- 5564 Katherine Ct
- 1839 Kingston Dr
- 2201 Augsburg Dr
- 1900 Bunny Trail
- 2105 Marlou Ct
- 2611 Chapel Dr E
- 5287 Weiss St
- 1607 Cranbrook Dr
- 70 Bunny Trail
- 76 Foxwood Dr
- 74 Foxwood Dr
- 80 Deer Trail
- 2588 E Greendale Dr
- 75 Foxwood Dr
- 73 Foxwood Dr
- 72 Bunny Trail
- 71 Bunny Trail
- 69 Bunny Trail