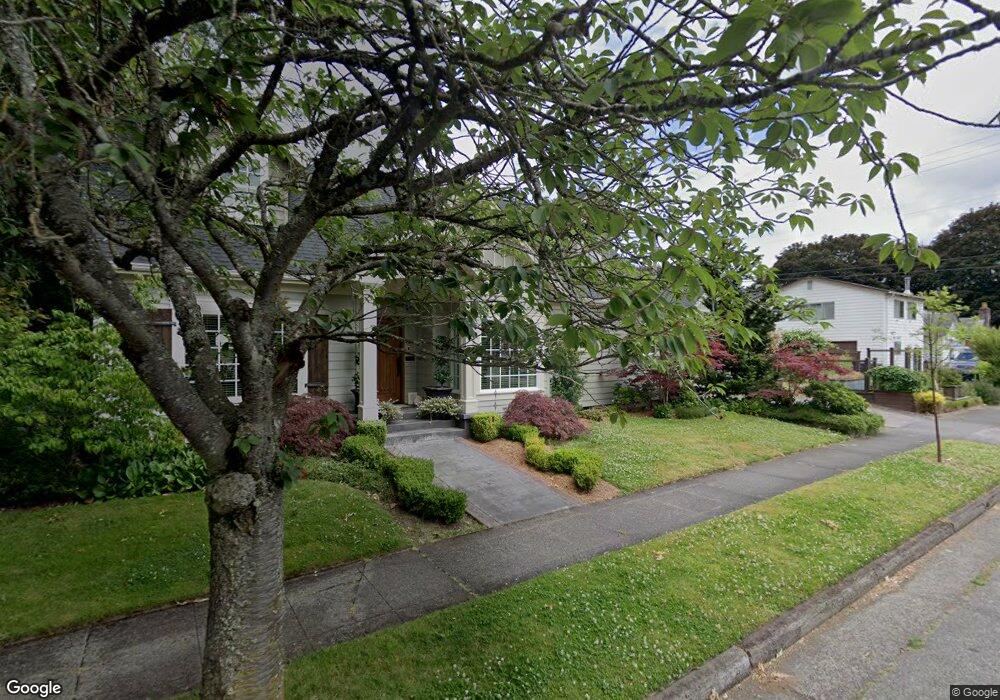
2130 Hudson St Longview, WA 98632
Old West Side NeighborhoodEstimated Value: $477,000 - $518,000
3
Beds
2
Baths
1,976
Sq Ft
$249/Sq Ft
Est. Value
About This Home
This home is located at 2130 Hudson St, Longview, WA 98632 and is currently estimated at $491,564, approximately $248 per square foot. 2130 Hudson St is a home located in Cowlitz County with nearby schools including Northlake Elementary School, Monticello Middle School, and R.A. Long High School.
Ownership History
Date
Name
Owned For
Owner Type
Purchase Details
Closed on
Oct 7, 2025
Sold by
Scroggins Gary L and Yost Cynthia D
Bought by
Scroggins-Yost Family Trust and Scroggins
Current Estimated Value
Purchase Details
Closed on
Jul 5, 2012
Sold by
Lang James A
Bought by
Scroggins Gary L and Yost Cynthia D
Home Financials for this Owner
Home Financials are based on the most recent Mortgage that was taken out on this home.
Original Mortgage
$142,405
Interest Rate
3.65%
Mortgage Type
New Conventional
Create a Home Valuation Report for This Property
The Home Valuation Report is an in-depth analysis detailing your home's value as well as a comparison with similar homes in the area
Home Values in the Area
Average Home Value in this Area
Purchase History
| Date | Buyer | Sale Price | Title Company |
|---|---|---|---|
| Scroggins-Yost Family Trust | -- | None Listed On Document | |
| Scroggins Gary L | $149,900 | Cowlitz County Title Company |
Source: Public Records
Mortgage History
| Date | Status | Borrower | Loan Amount |
|---|---|---|---|
| Previous Owner | Scroggins Gary L | $142,405 |
Source: Public Records
Tax History Compared to Growth
Tax History
| Year | Tax Paid | Tax Assessment Tax Assessment Total Assessment is a certain percentage of the fair market value that is determined by local assessors to be the total taxable value of land and additions on the property. | Land | Improvement |
|---|---|---|---|---|
| 2024 | $4,228 | $488,430 | $71,400 | $417,030 |
| 2023 | $3,881 | $430,230 | $71,400 | $358,830 |
| 2022 | $3,624 | $437,790 | $71,400 | $366,390 |
| 2021 | $3,530 | $364,510 | $71,400 | $293,110 |
| 2020 | $2,876 | $319,800 | $71,400 | $248,400 |
| 2019 | $2,787 | $273,351 | $71,400 | $201,951 |
| 2018 | $2,721 | $258,790 | $71,400 | $187,390 |
| 2017 | $2,443 | $207,530 | $71,380 | $136,150 |
| 2016 | $2,277 | $189,540 | $67,980 | $121,560 |
| 2015 | $2,399 | $180,530 | $67,980 | $112,550 |
| 2013 | -- | $181,150 | $66,000 | $115,150 |
Source: Public Records
Map
Nearby Homes
- 1429 21st Ave
- 1408 20th Ave Unit B1
- 1202 21st Ave
- 1951 Louisiana St
- 2132 Washington Way
- 947 19th Ave
- 1509 19th Ave
- 1505 19th Ave
- 1023 16th Ave
- 835 20th Ave
- 2727 Hemlock St
- 911 16th Ave
- 1602 Delaware St
- 2762 Louisiana St
- 2843 Hemlock St
- 2902 Garfield St
- 2787 Maryland St
- 1337 10th Ave
- 1821 Nichols Blvd
- 2848 Dover St