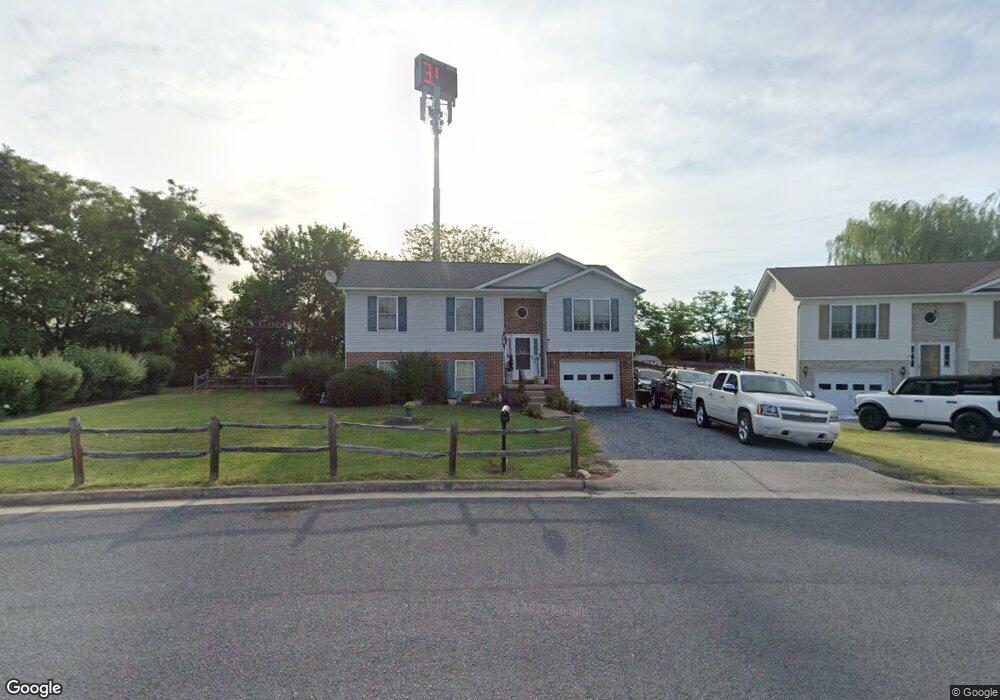
2130 Mark Dr Middletown, VA 22645
Estimated Value: $329,477 - $370,000
3
Beds
2
Baths
--
Sq Ft
9,148
Sq Ft Lot
About This Home
This home is located at 2130 Mark Dr, Middletown, VA 22645 and is currently estimated at $348,619. 2130 Mark Dr is a home located in Frederick County with nearby schools including Middletown Elementary School, Robert E. Aylor Middle School, and Sherando High School.
Ownership History
Date
Name
Owned For
Owner Type
Purchase Details
Closed on
Oct 31, 2008
Sold by
Welsh Jonathan R
Bought by
Sine Yancey P
Current Estimated Value
Home Financials for this Owner
Home Financials are based on the most recent Mortgage that was taken out on this home.
Original Mortgage
$189,173
Outstanding Balance
$122,633
Interest Rate
5.83%
Mortgage Type
FHA
Estimated Equity
$225,986
Purchase Details
Closed on
Sep 26, 2002
Sold by
E M C Mtg Corp
Bought by
Welsh Jonathan R
Home Financials for this Owner
Home Financials are based on the most recent Mortgage that was taken out on this home.
Original Mortgage
$132,815
Interest Rate
6.25%
Purchase Details
Closed on
Jul 31, 2000
Sold by
Russell Glen W
Bought by
Jackson Thomasine L
Home Financials for this Owner
Home Financials are based on the most recent Mortgage that was taken out on this home.
Original Mortgage
$109,944
Interest Rate
8.18%
Create a Home Valuation Report for This Property
The Home Valuation Report is an in-depth analysis detailing your home's value as well as a comparison with similar homes in the area
Home Values in the Area
Average Home Value in this Area
Purchase History
| Date | Buyer | Sale Price | Title Company |
|---|---|---|---|
| Sine Yancey P | $190,200 | -- | |
| Welsh Jonathan R | $134,900 | -- | |
| Jackson Thomasine L | $110,000 | -- |
Source: Public Records
Mortgage History
| Date | Status | Borrower | Loan Amount |
|---|---|---|---|
| Open | Sine Yancey P | $189,173 | |
| Previous Owner | Welsh Jonathan R | $132,815 | |
| Previous Owner | Jackson Thomasine L | $109,944 |
Source: Public Records
Tax History
| Year | Tax Paid | Tax Assessment Tax Assessment Total Assessment is a certain percentage of the fair market value that is determined by local assessors to be the total taxable value of land and additions on the property. | Land | Improvement |
|---|---|---|---|---|
| 2025 | $1,489 | $310,140 | $83,000 | $227,140 |
| 2024 | $651 | $255,200 | $67,000 | $188,200 |
| 2023 | $1,302 | $255,200 | $67,000 | $188,200 |
| 2022 | $1,313 | $215,200 | $62,000 | $153,200 |
| 2021 | $1,313 | $215,200 | $62,000 | $153,200 |
| 2020 | $1,211 | $198,500 | $62,000 | $136,500 |
| 2019 | $1,211 | $198,500 | $62,000 | $136,500 |
| 2018 | $1,125 | $184,400 | $62,000 | $122,400 |
| 2017 | $1,106 | $184,400 | $62,000 | $122,400 |
| 2016 | $991 | $165,200 | $49,500 | $115,700 |
| 2015 | $925 | $165,200 | $49,500 | $115,700 |
| 2014 | $450 | $152,900 | $49,500 | $103,400 |
Source: Public Records
Map
Nearby Homes
- 7786 Carolyn Ave
- 135 Birmingham Dr
- 139 Kensington Cir
- 2339 Third St
- 471 Coville St
- 201 Coville St
- 151 Cougill Rd
- 0 St
- 100 Midsummer Ln
- 104 Midsummer Ln
- 2239 Sixth St
- 0 Rd Unit VAFV2039608
- 102 Midsummer Ln
- 0 Reliance Rd Unit VAFV2013246
- 0 Reliance Rd Unit VAWR139520
- 0 Reliance Rd Unit VAFV2039508
- 0 Huttle Rd Unit VAFV2038332
- 6837 Valley Pike
- LOT 3 Arapaho Ln
- 5670 Long Meadow Rd
Your Personal Tour Guide
Ask me questions while you tour the home.