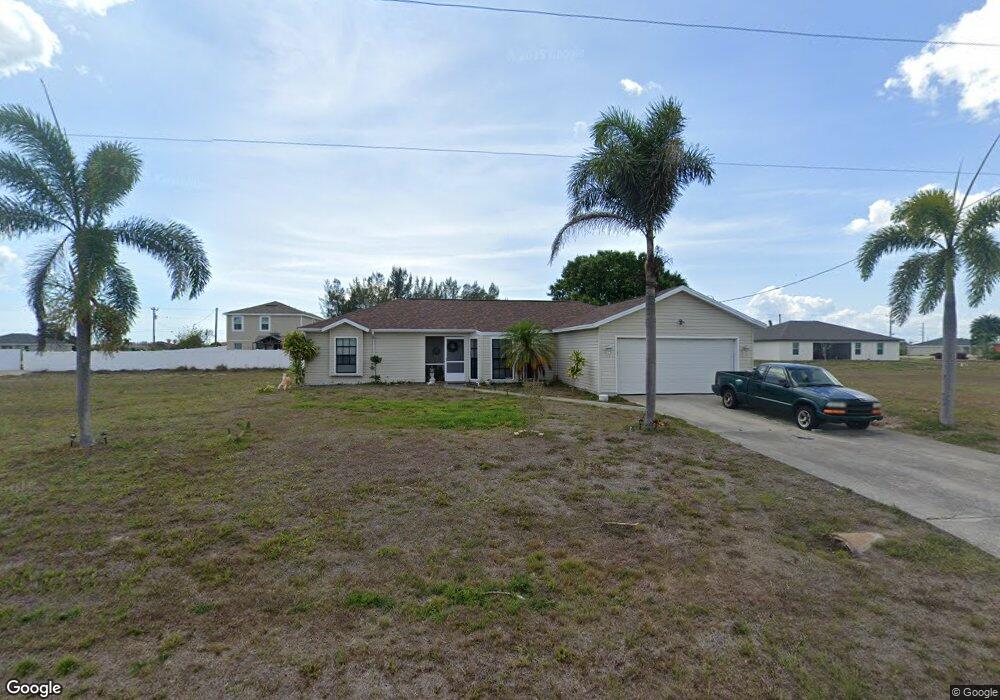
2130 NW 6th Ave Cape Coral, FL 33993
Mariner NeighborhoodEstimated Value: $264,572 - $300,000
3
Beds
2
Baths
1,554
Sq Ft
$183/Sq Ft
Est. Value
About This Home
This home is located at 2130 NW 6th Ave, Cape Coral, FL 33993 and is currently estimated at $283,643, approximately $182 per square foot. 2130 NW 6th Ave is a home located in Lee County with nearby schools including Dr. Carrie D. Robinson Littleton Elementary School, Caloosa Elementary School, and Tropic Isles Elementary School.
Ownership History
Date
Name
Owned For
Owner Type
Purchase Details
Closed on
Sep 24, 2024
Sold by
Connor Alfonso and Connor Lourdes
Bought by
Connor Alfonso and Connor Lourdes
Current Estimated Value
Purchase Details
Closed on
Jul 13, 2017
Sold by
Cheek Ronald
Bought by
Blue River Capital Llc
Purchase Details
Closed on
Jan 5, 2010
Sold by
Fitzgerald Susan
Bought by
Federal National Mortgage Association
Purchase Details
Closed on
Oct 29, 2001
Sold by
Clerk Circuit Court
Bought by
Johnston George
Purchase Details
Closed on
Jan 27, 1994
Sold by
Moore Deborah and Mick Deborah L
Bought by
Rinko Robert H and Anson James L
Home Financials for this Owner
Home Financials are based on the most recent Mortgage that was taken out on this home.
Original Mortgage
$55,200
Interest Rate
7.1%
Create a Home Valuation Report for This Property
The Home Valuation Report is an in-depth analysis detailing your home's value as well as a comparison with similar homes in the area
Home Values in the Area
Average Home Value in this Area
Purchase History
| Date | Buyer | Sale Price | Title Company |
|---|---|---|---|
| Connor Alfonso | $100 | None Listed On Document | |
| Blue River Capital Llc | $80,000 | Title Speciallists Of The Gu | |
| Federal National Mortgage Association | -- | None Available | |
| Johnston George | $57,100 | -- | |
| Rinko Robert H | $55,200 | -- |
Source: Public Records
Mortgage History
| Date | Status | Borrower | Loan Amount |
|---|---|---|---|
| Previous Owner | Rinko Robert H | $55,200 |
Source: Public Records
Tax History Compared to Growth
Tax History
| Year | Tax Paid | Tax Assessment Tax Assessment Total Assessment is a certain percentage of the fair market value that is determined by local assessors to be the total taxable value of land and additions on the property. | Land | Improvement |
|---|---|---|---|---|
| 2025 | $2,514 | $210,749 | $32,300 | $178,449 |
| 2024 | $2,386 | $145,995 | -- | -- |
| 2023 | $2,386 | $141,743 | $0 | $0 |
| 2022 | $2,186 | $137,615 | $0 | $0 |
| 2021 | $2,176 | $133,607 | $9,000 | $124,607 |
| 2020 | $2,805 | $125,169 | $9,200 | $115,969 |
| 2019 | $2,706 | $121,123 | $10,500 | $110,623 |
| 2018 | $2,665 | $117,095 | $10,500 | $106,595 |
| 2017 | $2,405 | $112,236 | $6,800 | $105,436 |
| 2016 | $2,168 | $94,979 | $6,800 | $88,179 |
| 2015 | $1,994 | $82,400 | $6,300 | $76,100 |
| 2014 | $1,881 | $80,898 | $5,640 | $75,258 |
| 2013 | -- | $69,499 | $3,900 | $65,599 |
Source: Public Records
Map
Nearby Homes
- 2125 NW 6th Place
- 2124 NW 6th Place
- 2128 NW 6th Place
- 2110 NW 6th Place
- 2204 NW 6th Place
- 2216 NW 6th Place
- 2218 NW 5th Place
- 508 NW 21st Terrace
- 519 NW 20th Terrace
- 2210 NW 7th Ave
- 529 NW 23rd St
- 2231 NW 7th Ave
- 2223 NW 7th Place
- 508 NW 23rd Terrace
- 521 NW 23rd St
- 522 NW 20th St
- 2244 NW 7th Ave
- 2232 NW 7th Place
- 504 NW 20th St
- 2408 NW 6th Place
- 2126 NW 6th Ave
- 2122 NW 6th Ave
- 2129 NW 6th Ave
- 2129 NW 6 Ave
- 2207 NW 6th Place
- 2125 NW 6th Ave
- 2203 NW 6th Ave
- 2210 NW 6th Ave
- 2207 NW 6th Ave
- 2117 NW 6th Place
- 2211 NW 6th Ave
- 2126 NW 5th Place
- 2202 NW 5th Place
- 2214 NW 6th Ave
- 602 NW 21st Terrace
- 2124 NW 6th Place Unit 31
- 2118 NW 6th Ave
- 2208 NW 6th Place
- 2118 NW 5th Place
- 2210 NW 5th Place