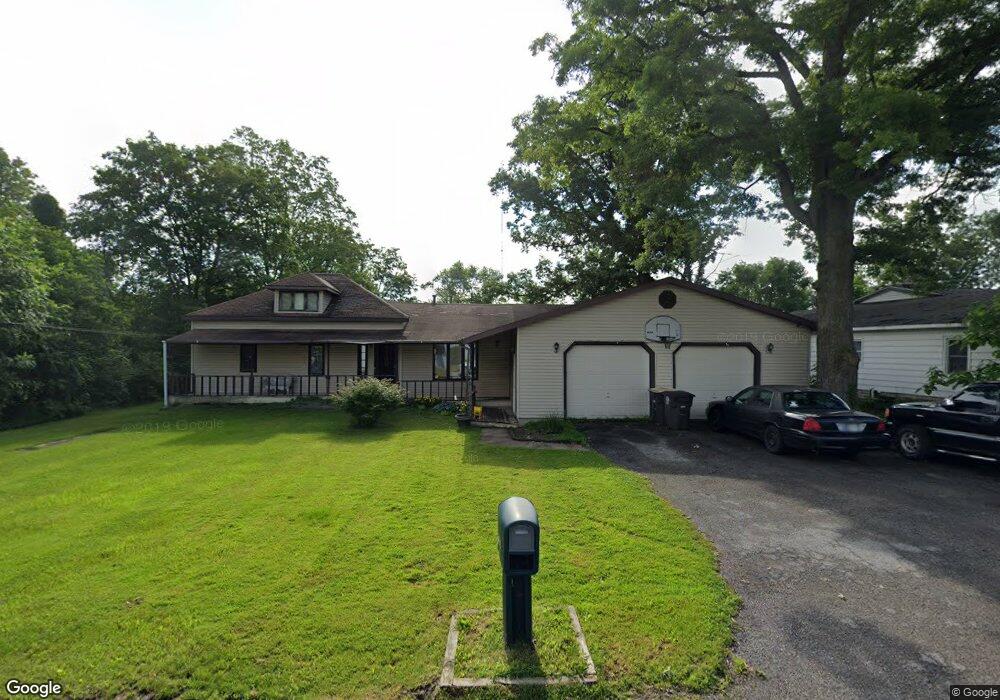
2130 Olladale Dr Fort Wayne, IN 46808
Bass-Leesburg Civic NeighborhoodEstimated Value: $204,000 - $234,000
2
Beds
2
Baths
1,997
Sq Ft
$112/Sq Ft
Est. Value
About This Home
This home is located at 2130 Olladale Dr, Fort Wayne, IN 46808 and is currently estimated at $223,141, approximately $111 per square foot. 2130 Olladale Dr is a home located in Allen County with nearby schools including Northrop High School, Queen of Angels Catholic School, and Cornerstone College Prep School.
Ownership History
Date
Name
Owned For
Owner Type
Purchase Details
Closed on
Oct 28, 2005
Sold by
Meshberger James L
Bought by
Koenemann Dustin L
Current Estimated Value
Home Financials for this Owner
Home Financials are based on the most recent Mortgage that was taken out on this home.
Original Mortgage
$108,000
Outstanding Balance
$71,558
Interest Rate
9.72%
Mortgage Type
Fannie Mae Freddie Mac
Estimated Equity
$151,583
Purchase Details
Closed on
Aug 23, 2005
Sold by
Fannie Mae
Bought by
Meshberger James L
Purchase Details
Closed on
Aug 4, 2005
Sold by
Matrix Financial Services Corp
Bought by
Federal National Mortgage Association
Purchase Details
Closed on
Jun 1, 2005
Sold by
Pennington Jesse S and Pennington Linda G
Bought by
Matrix Financial Services Corp
Create a Home Valuation Report for This Property
The Home Valuation Report is an in-depth analysis detailing your home's value as well as a comparison with similar homes in the area
Home Values in the Area
Average Home Value in this Area
Purchase History
| Date | Buyer | Sale Price | Title Company |
|---|---|---|---|
| Koenemann Dustin L | -- | Investor Title Env | |
| Meshberger James L | -- | Investors Titlecorp | |
| Federal National Mortgage Association | -- | Investors Titlecorp | |
| Matrix Financial Services Corp | $69,937 | Investors Titlecorp |
Source: Public Records
Mortgage History
| Date | Status | Borrower | Loan Amount |
|---|---|---|---|
| Open | Koenemann Dustin L | $108,000 |
Source: Public Records
Tax History Compared to Growth
Tax History
| Year | Tax Paid | Tax Assessment Tax Assessment Total Assessment is a certain percentage of the fair market value that is determined by local assessors to be the total taxable value of land and additions on the property. | Land | Improvement |
|---|---|---|---|---|
| 2024 | $1,785 | $179,700 | $27,300 | $152,400 |
| 2022 | $1,780 | $160,200 | $27,300 | $132,900 |
| 2021 | $1,498 | $136,300 | $27,300 | $109,000 |
| 2020 | $1,378 | $128,200 | $27,300 | $100,900 |
| 2019 | $1,144 | $111,400 | $27,300 | $84,100 |
| 2018 | $1,099 | $108,000 | $27,300 | $80,700 |
| 2017 | $919 | $96,600 | $27,300 | $69,300 |
| 2016 | $1,178 | $110,700 | $27,300 | $83,400 |
| 2014 | $1,155 | $112,500 | $27,300 | $85,200 |
| 2013 | $1,181 | $115,100 | $27,300 | $87,800 |
Source: Public Records
Map
Nearby Homes
- 2921 Overlook Dr
- 2814 Autumn Leaf Ln
- 1818 Lindenwood Ave
- 1625 Olladale Dr
- 0 Butler Rd Unit 202533578
- 2121 Hillegas Rd
- 1525 Fall Creek Pkwy
- 1417 Misty River Dr
- 2926 Sprunger Rd W
- 1840 Rosemont Dr
- 1936 Spring St
- 1818 Rosemont Dr
- 1743 Trinity Blvd
- 2422 Stanford Ave
- 1653 Rosemont Dr
- 1721 W 4th St
- 1646 Spring St
- 2936 Stanford Ave
- 1702 Sinclair St
- 1712 High St
- 2122 Olladale Dr
- 2110 Olladale Dr
- 2104 Olladale Dr
- 2107 Olladale Dr
- 2117 Chochtimar Trail
- 2222 Olladale Dr
- 2109 Chochtimar Trail
- 2125 Chochtimar Trail
- 2026 Olladale Dr
- 2103 Chochtimar Trail
- 2205 Chochtimar Trail
- 2215 Chochtimar Trail
- 2020 Olladale Dr
- 2118 Chochtimar Trail
- 2110 Chochtimar Trail
- 3126 Trenton Ct
- 2104 Chochtimar Trail
- 3113 Trenton Ct
- 3120 Trenton Ct
- 2009 Chochtimar Trail