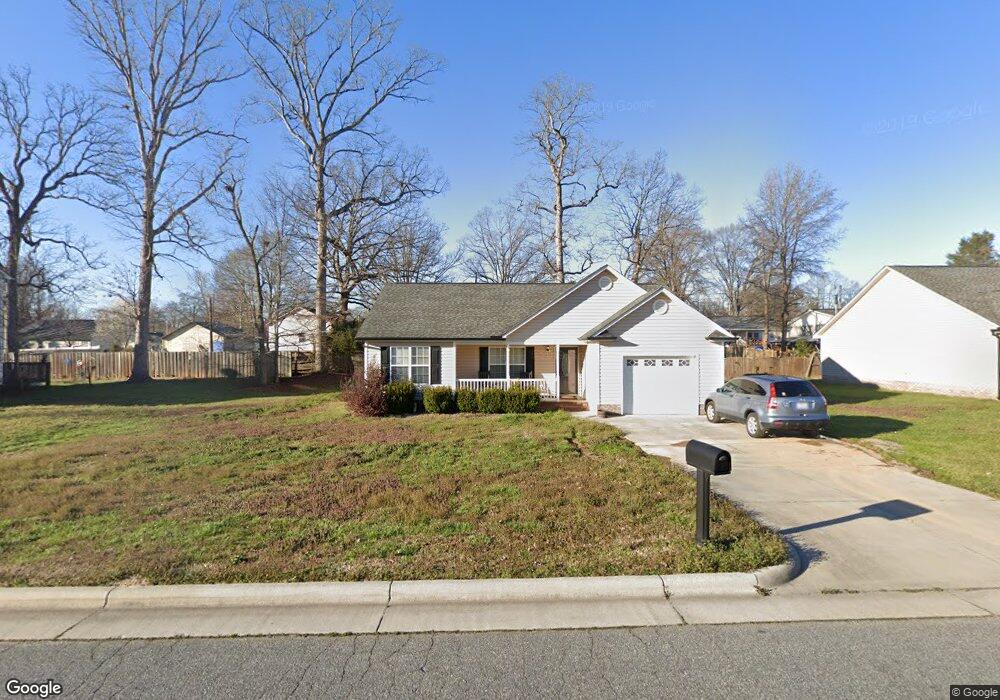
2131 Brantley Creek Dr Kannapolis, NC 28083
Estimated Value: $290,399 - $304,000
3
Beds
2
Baths
1,233
Sq Ft
$239/Sq Ft
Est. Value
About This Home
This home is located at 2131 Brantley Creek Dr, Kannapolis, NC 28083 and is currently estimated at $294,100, approximately $238 per square foot. 2131 Brantley Creek Dr is a home located in Cabarrus County with nearby schools including Jackson Park Elementary School, Kannapolis Middle, and A.L. Brown High School.
Ownership History
Date
Name
Owned For
Owner Type
Purchase Details
Closed on
Feb 8, 2010
Sold by
Scullin John F
Bought by
Banks Tracy N
Current Estimated Value
Home Financials for this Owner
Home Financials are based on the most recent Mortgage that was taken out on this home.
Original Mortgage
$91,575
Outstanding Balance
$63,444
Interest Rate
5.99%
Mortgage Type
FHA
Estimated Equity
$230,656
Purchase Details
Closed on
Nov 17, 2006
Sold by
Jdl Homes Inc
Bought by
Scullin John F
Purchase Details
Closed on
Jul 7, 2006
Sold by
Ips Development Llc
Bought by
Jdl Homes Inc
Home Financials for this Owner
Home Financials are based on the most recent Mortgage that was taken out on this home.
Original Mortgage
$109,000
Interest Rate
6.55%
Mortgage Type
Construction
Create a Home Valuation Report for This Property
The Home Valuation Report is an in-depth analysis detailing your home's value as well as a comparison with similar homes in the area
Home Values in the Area
Average Home Value in this Area
Purchase History
| Date | Buyer | Sale Price | Title Company |
|---|---|---|---|
| Banks Tracy N | $98,000 | None Available | |
| Scullin John F | $110,000 | None Available | |
| Jdl Homes Inc | $22,500 | None Available |
Source: Public Records
Mortgage History
| Date | Status | Borrower | Loan Amount |
|---|---|---|---|
| Open | Banks Tracy N | $91,575 | |
| Previous Owner | Jdl Homes Inc | $109,000 |
Source: Public Records
Tax History Compared to Growth
Tax History
| Year | Tax Paid | Tax Assessment Tax Assessment Total Assessment is a certain percentage of the fair market value that is determined by local assessors to be the total taxable value of land and additions on the property. | Land | Improvement |
|---|---|---|---|---|
| 2025 | $3,349 | $294,910 | $60,000 | $234,910 |
| 2024 | $3,349 | $294,910 | $60,000 | $234,910 |
| 2023 | $2,065 | $150,740 | $33,000 | $117,740 |
| 2022 | $2,065 | $150,740 | $33,000 | $117,740 |
| 2021 | $2,065 | $150,740 | $33,000 | $117,740 |
| 2020 | $2,065 | $150,740 | $33,000 | $117,740 |
| 2019 | $1,523 | $111,190 | $17,000 | $94,190 |
| 2018 | $1,501 | $111,190 | $17,000 | $94,190 |
| 2017 | $1,479 | $111,190 | $17,000 | $94,190 |
| 2016 | $1,479 | $123,130 | $24,000 | $99,130 |
| 2015 | -- | $123,130 | $24,000 | $99,130 |
| 2014 | -- | $123,130 | $24,000 | $99,130 |
Source: Public Records
Map
Nearby Homes
- 2100 Brantley Rd
- 2122 Brantley Rd
- 2040 Brantley Creek Dr
- 2211 Medlin Ct
- 2208 Brantley Rd
- 520 Wright Ave
- 1422 Midlake Rd
- 1905 Clay St
- 516 Collins St
- 1517 Jamaica Rd
- 1526 Shepard St
- 2412 Brantley Rd
- 252 Forest Pond Rd
- 1406 Shepard St
- 2008 Woodlawn St
- 2105 Woodlawn St
- 776 Washington Ln
- 311 Jean Ave
- 314 N Little Texas Rd
- 807 Carolyn Ave
- 2131 Brantley Creek Dr Unit 58
- 2121 Brantley Creek Dr
- 2141 Brantley Creek Dr
- 2102 Brantley Rd
- 2140 Brantley Creek Dr
- 2130 Brantley Creek Dr
- 2146 Brantley Creek Dr
- 2111 Brantley Creek Dr
- 2120 Brantley Creek Dr
- 2006 Brantley Rd
- 2150 Brantley Creek Dr
- 2151 Brantley Creek Dr
- 2050 Samantha Dr
- 2056 Samantha Dr
- 2110 Brantley Creek Dr
- 2046 Samantha Dr
- 408 Carsil Way
- 2060 Samantha Dr
- 2101 Brantley Creek Dr
- 2160 Brantley Creek Dr