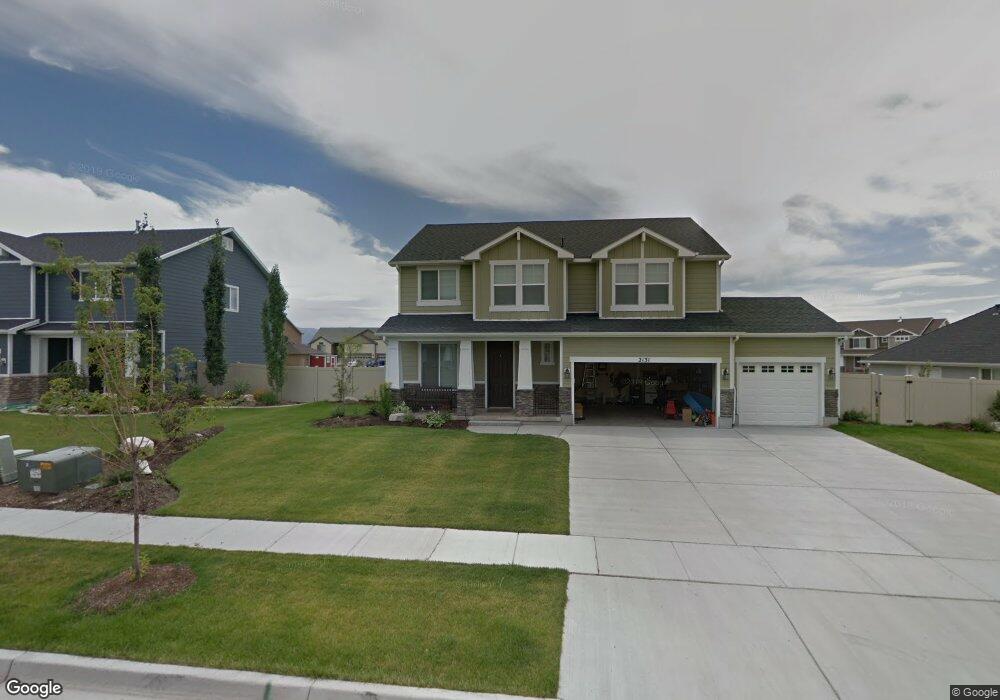
2131 Chapman Ln Farmington, UT 84025
Estimated Value: $688,000 - $722,000
4
Beds
3
Baths
2,400
Sq Ft
$293/Sq Ft
Est. Value
About This Home
This home is located at 2131 Chapman Ln, Farmington, UT 84025 and is currently estimated at $704,385, approximately $293 per square foot. 2131 Chapman Ln is a home located in Davis County with nearby schools including Canyon Creek Elementary, Farmington High, and Farmington Junior High School.
Ownership History
Date
Name
Owned For
Owner Type
Purchase Details
Closed on
Apr 27, 2023
Sold by
Lund Mark T
Bought by
Lund Capital Llc
Current Estimated Value
Purchase Details
Closed on
Apr 30, 2020
Sold by
Lund Mark
Bought by
Lund Mark T and Lund Meredith
Home Financials for this Owner
Home Financials are based on the most recent Mortgage that was taken out on this home.
Original Mortgage
$349,600
Interest Rate
3.6%
Mortgage Type
New Conventional
Purchase Details
Closed on
May 4, 2010
Sold by
Meadows Woodside Farmington
Bought by
Fisher Russell K and Fisher Kimberlee A
Home Financials for this Owner
Home Financials are based on the most recent Mortgage that was taken out on this home.
Original Mortgage
$259,571
Interest Rate
4.75%
Mortgage Type
FHA
Purchase Details
Closed on
Mar 26, 2010
Sold by
Pleasant Valley Investments Lc
Bought by
Woodside Farmington Meadows Llc
Home Financials for this Owner
Home Financials are based on the most recent Mortgage that was taken out on this home.
Original Mortgage
$259,571
Interest Rate
4.75%
Mortgage Type
FHA
Create a Home Valuation Report for This Property
The Home Valuation Report is an in-depth analysis detailing your home's value as well as a comparison with similar homes in the area
Home Values in the Area
Average Home Value in this Area
Purchase History
| Date | Buyer | Sale Price | Title Company |
|---|---|---|---|
| Lund Capital Llc | -- | None Listed On Document | |
| Lund Mark T | -- | Accommodation | |
| Lund Mark | -- | Backman Title Serv | |
| Fisher Russell K | -- | Us Title Company Of Utah | |
| Woodside Farmington Meadows Llc | -- | Accommodation |
Source: Public Records
Mortgage History
| Date | Status | Borrower | Loan Amount |
|---|---|---|---|
| Previous Owner | Lund Mark | $349,600 | |
| Previous Owner | Fisher Russell K | $259,571 |
Source: Public Records
Tax History Compared to Growth
Tax History
| Year | Tax Paid | Tax Assessment Tax Assessment Total Assessment is a certain percentage of the fair market value that is determined by local assessors to be the total taxable value of land and additions on the property. | Land | Improvement |
|---|---|---|---|---|
| 2024 | $3,687 | $345,399 | $160,670 | $184,729 |
| 2023 | $3,526 | $604,000 | $256,714 | $347,286 |
| 2022 | $3,386 | $327,250 | $140,611 | $186,639 |
| 2021 | $3,142 | $451,000 | $150,271 | $300,729 |
| 2020 | $2,891 | $404,000 | $144,078 | $259,922 |
| 2019 | $2,944 | $403,000 | $160,605 | $242,395 |
| 2018 | $2,743 | $370,000 | $145,264 | $224,736 |
| 2016 | $2,491 | $173,910 | $56,316 | $117,594 |
| 2015 | $2,596 | $172,810 | $56,316 | $116,494 |
| 2014 | $2,468 | $168,529 | $47,108 | $121,421 |
| 2013 | -- | $173,356 | $34,747 | $138,609 |
Source: Public Records
Map
Nearby Homes
- 1566 W Pheasant Place
- 556 Innovator Dr Unit 158
- 2009 W Lonestar Dr
- 926 N 1875 W
- 2274 S 50 E
- 2261 S 50 E
- 276 E 2200 S
- 1844 Country Bend Cir
- 2266 S Betsys Way
- 69 W 2200 S
- 2226 S Betsys Way
- 562 Innovator Dr Unit 155
- 278 E Shepard Ln
- 1488 W Kiera Ct Unit 148
- 1484 W Kiera Ct Unit 146
- 1472 W Cook Ln Unit 164
- 604 Sego Way Unit 220
- 604 Sego Way Unit 207
- 597 N Nichole Ln Unit 205
- Live-Work Townhomes Plan at Station Park
- 2113 Chapman Ln
- 2149 Chapman Ln
- 578 Loveland Ln
- 2104 Loveland Ln
- 2132 Chapman Ln
- 2116 Chapman Ln
- 2152 Chapman Ln
- 2168 Chapman Ln
- 2102 Chapman Ln
- 589 Loveland Ln
- 561 Loveland Ln
- 2087 Chapman Ln
- 2088 Loveland Ln
- 2143 Rifleman Dr
- 2151 Rifleman Dr
- 2179 Loveland Ln
- 2086 Chapman Ln
- 2101 Loveland Ln
- 2182 Loveland Ln
- 2123 Loveland Ln