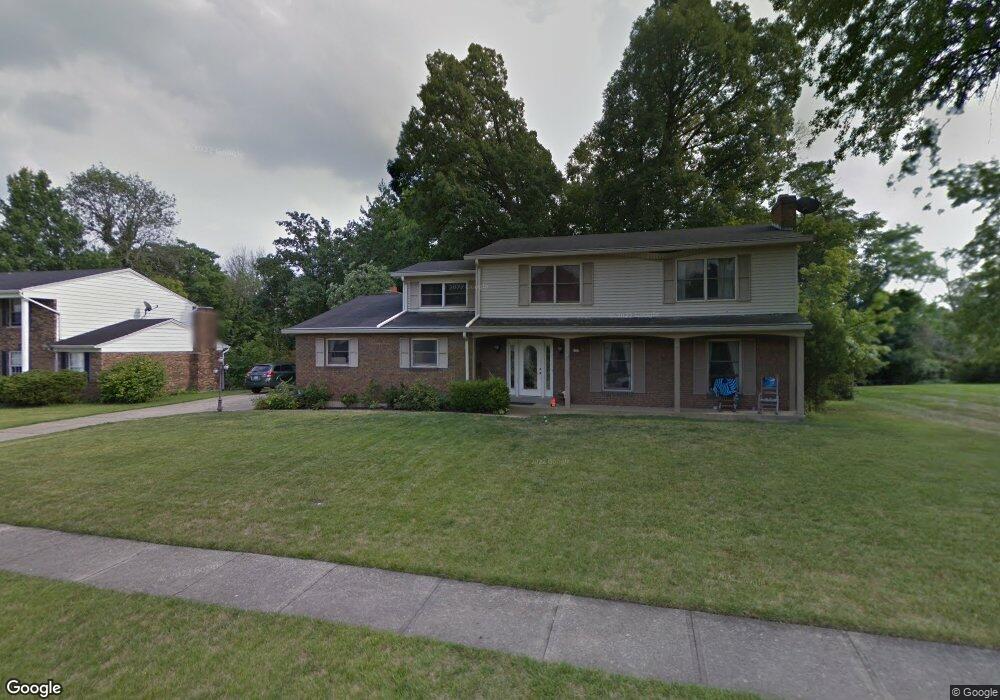
2131 Raeburn Dr Cincinnati, OH 45223
Mount Airy NeighborhoodEstimated Value: $461,000 - $495,918
4
Beds
4
Baths
2,508
Sq Ft
$190/Sq Ft
Est. Value
About This Home
This home is located at 2131 Raeburn Dr, Cincinnati, OH 45223 and is currently estimated at $477,730, approximately $190 per square foot. 2131 Raeburn Dr is a home located in Hamilton County with nearby schools including Chase Elementary School, Robert A. Taft Information Technology High School, and Western Hills High School.
Ownership History
Date
Name
Owned For
Owner Type
Purchase Details
Closed on
Sep 1, 2022
Sold by
Pankiewicz Walter M
Bought by
Pankiewicz Walter T and Pankiewicz Taina M
Current Estimated Value
Purchase Details
Closed on
Dec 28, 2005
Sold by
Cerminaro Michele A and Cerminaro Patrick
Bought by
Pankiewicz Walter T and Pankiewicz Taina M
Home Financials for this Owner
Home Financials are based on the most recent Mortgage that was taken out on this home.
Original Mortgage
$200,000
Interest Rate
6.42%
Mortgage Type
Unknown
Purchase Details
Closed on
Oct 31, 2003
Sold by
Frederick Dorothy A and Frederick Kenneth A
Bought by
Kidd Michele A
Home Financials for this Owner
Home Financials are based on the most recent Mortgage that was taken out on this home.
Original Mortgage
$168,000
Interest Rate
6.01%
Mortgage Type
Unknown
Purchase Details
Closed on
Oct 1, 1993
Sold by
Frederick Kenneth A and Frederick Dorothy A
Bought by
Frederick Dorothy A and Frederick Kenneth A
Create a Home Valuation Report for This Property
The Home Valuation Report is an in-depth analysis detailing your home's value as well as a comparison with similar homes in the area
Home Values in the Area
Average Home Value in this Area
Purchase History
| Date | Buyer | Sale Price | Title Company |
|---|---|---|---|
| Pankiewicz Walter T | -- | -- | |
| Pankiewicz Walter T | -- | None Listed On Document | |
| Pankiewicz Walter T | $250,000 | Land America | |
| Kidd Michele A | $210,000 | -- | |
| Frederick Dorothy A | -- | -- |
Source: Public Records
Mortgage History
| Date | Status | Borrower | Loan Amount |
|---|---|---|---|
| Previous Owner | Pankiewicz Walter T | $200,000 | |
| Previous Owner | Kidd Michele A | $168,000 |
Source: Public Records
Tax History
| Year | Tax Paid | Tax Assessment Tax Assessment Total Assessment is a certain percentage of the fair market value that is determined by local assessors to be the total taxable value of land and additions on the property. | Land | Improvement |
|---|---|---|---|---|
| 2025 | $8,718 | $141,323 | $18,480 | $122,843 |
| 2024 | $8,458 | $141,323 | $18,480 | $122,843 |
| 2023 | $8,646 | $141,323 | $18,480 | $122,843 |
| 2022 | $7,088 | $103,842 | $20,496 | $83,346 |
| 2021 | $6,818 | $103,842 | $20,496 | $83,346 |
| 2020 | $7,016 | $103,842 | $20,496 | $83,346 |
| 2019 | $6,200 | $79,289 | $16,800 | $62,489 |
| 2018 | $5,866 | $79,289 | $16,800 | $62,489 |
| 2017 | $5,572 | $79,289 | $16,800 | $62,489 |
| 2016 | $6,141 | $86,184 | $19,656 | $66,528 |
| 2015 | $5,537 | $86,184 | $19,656 | $66,528 |
| 2014 | $5,576 | $86,184 | $19,656 | $66,528 |
| 2013 | $4,851 | $73,661 | $16,800 | $56,861 |
Source: Public Records
Map
Nearby Homes
- 2088 Raeburn Dr
- 4658 Reemelin Ave
- 4669 Kirby Ave
- 1966 Kentucky Ave
- 1973 Kentucky Ave
- 5425 Kirby Ave
- 4373 Virginia Ave
- 4361 Virginia Ave
- 4553 Anthony Ave
- 2637 Firtree Ct
- 1650 Philomena Ave
- 1949 Washburn St
- 1641 Frederick Ave
- 4361 Badgeley St
- 1919 Washburn St
- 4327 Hays Ave
- 4421 Colerain Ave
- 4719 Hamilton Ave
- 4411 Colerain Ave
- 4222 Georgia Ave
- 2125 Raeburn Dr
- 2130 Raeburn Dr
- 2124 Raeburn Dr
- 2141 Raeburn Dr
- 2140 Raeburn Dr
- 2119 Raeburn Dr
- 2118 Raeburn Dr
- 2149 Raeburn Dr
- 2113 Raeburn Dr
- 2168 Raeburn Dr
- 2112 Raeburn Dr
- 2176 Raeburn Dr
- 2107 Raeburn Dr
- 2159 Raeburn Dr
- 4814 Chapel Ridge Dr
- 2106 Raeburn Dr
- 4808 Chapel Ridge Dr
- 2101 Raeburn Dr
- 2184 Raeburn Dr
- 2100 Raeburn Dr
Your Personal Tour Guide
Ask me questions while you tour the home.