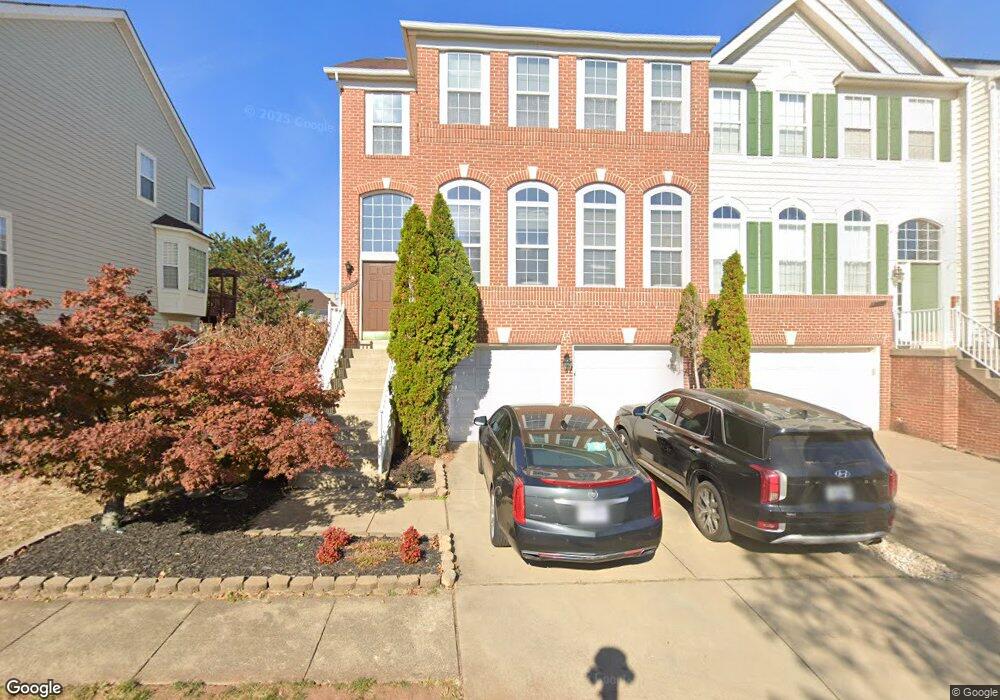
21310 Victorias Cross Terrace Ashburn, VA 20147
Estimated Value: $661,000 - $784,000
3
Beds
4
Baths
2,850
Sq Ft
$262/Sq Ft
Est. Value
About This Home
This home is located at 21310 Victorias Cross Terrace, Ashburn, VA 20147 and is currently estimated at $745,683, approximately $261 per square foot. 21310 Victorias Cross Terrace is a home located in Loudoun County with nearby schools including Dominion Trail Elementary School, Farmwell Station Middle School, and Broad Run High School.
Ownership History
Date
Name
Owned For
Owner Type
Purchase Details
Closed on
Jun 24, 2008
Sold by
Quann Jeffrey L
Bought by
Korangy Amir A
Current Estimated Value
Home Financials for this Owner
Home Financials are based on the most recent Mortgage that was taken out on this home.
Original Mortgage
$422,747
Outstanding Balance
$271,552
Interest Rate
6.07%
Mortgage Type
FHA
Estimated Equity
$474,131
Purchase Details
Closed on
Aug 2, 2002
Sold by
Lankford Shelton F
Bought by
Quann Jeffrey L
Home Financials for this Owner
Home Financials are based on the most recent Mortgage that was taken out on this home.
Original Mortgage
$264,000
Interest Rate
6.64%
Purchase Details
Closed on
Nov 24, 1999
Sold by
R J Homes
Bought by
Lankford Shelton F
Home Financials for this Owner
Home Financials are based on the most recent Mortgage that was taken out on this home.
Original Mortgage
$214,681
Interest Rate
7.77%
Create a Home Valuation Report for This Property
The Home Valuation Report is an in-depth analysis detailing your home's value as well as a comparison with similar homes in the area
Home Values in the Area
Average Home Value in this Area
Purchase History
| Date | Buyer | Sale Price | Title Company |
|---|---|---|---|
| Korangy Amir A | $430,000 | -- | |
| Quann Jeffrey L | $330,000 | -- | |
| Lankford Shelton F | $271,066 | -- |
Source: Public Records
Mortgage History
| Date | Status | Borrower | Loan Amount |
|---|---|---|---|
| Open | Korangy Amir A | $422,747 | |
| Previous Owner | Quann Jeffrey L | $264,000 | |
| Previous Owner | Lankford Shelton F | $214,681 |
Source: Public Records
Tax History Compared to Growth
Tax History
| Year | Tax Paid | Tax Assessment Tax Assessment Total Assessment is a certain percentage of the fair market value that is determined by local assessors to be the total taxable value of land and additions on the property. | Land | Improvement |
|---|---|---|---|---|
| 2025 | $5,784 | $718,540 | $198,500 | $520,040 |
| 2024 | $5,931 | $685,610 | $198,500 | $487,110 |
| 2023 | $5,324 | $608,430 | $198,500 | $409,930 |
| 2022 | $5,601 | $629,300 | $183,500 | $445,800 |
| 2021 | $5,450 | $556,170 | $168,500 | $387,670 |
| 2020 | $5,340 | $515,980 | $128,500 | $387,480 |
| 2019 | $5,142 | $492,050 | $128,500 | $363,550 |
| 2018 | $5,027 | $463,330 | $118,500 | $344,830 |
| 2017 | $5,157 | $458,380 | $118,500 | $339,880 |
| 2016 | $5,222 | $456,050 | $0 | $0 |
| 2015 | $5,288 | $347,410 | $0 | $347,410 |
| 2014 | $5,135 | $326,120 | $0 | $326,120 |
Source: Public Records
Map
Nearby Homes
- 21292 Victorias Cross Terrace
- 21376 Clappertown Dr
- 21250 Dubois Ct
- 43877 Sandburg Square
- 21480 Trowbridge Square
- 43793 Steinbeck Square
- 21081 Bitterroot Terrace
- 43800 Stonebridge Dr
- 44289 Suscon Square
- 21031 Lemon Springs Terrace
- 44248 Suscon Square
- 43866 Laburnum Square
- 43842 Artsmith Terrace
- 43949 Bruceton Mills Cir
- 20961 Cohasset Terrace
- 43756 Woodworth Ct
- 20945 Rubles Mill Ct
- 21581 Kouros Ct
- 21731 Dovekie Terrace Unit 408
- 21731 Dovekie Terrace Unit 205
- 21312 Victorias Cross Terrace
- 21306 Victorias Cross Terrace
- 21314 Victorias Cross Terrace
- 21304 Victorias Cross Terrace
- 21316 Victorias Cross Terrace
- 44071 Saxony Terrace
- 21302 Victorias Cross Terrace
- 44073 Saxony Terrace
- 21300 Victorias Cross Terrace
- 44075 Saxony Terrace
- 21322 Victorias Cross Terrace
- 21320 Victorias Cross Terrace
- 21324 Victorias Cross Terrace
- 21326 Victorias Cross Terrace
- 44077 Saxony Terrace
- 21328 Victorias Cross Terrace
- 21286 Victorias Cross Terrace
- 21284 Victorias Cross Terrace
- 21282 Victorias Cross Terrace
- 44079 Saxony Terrace