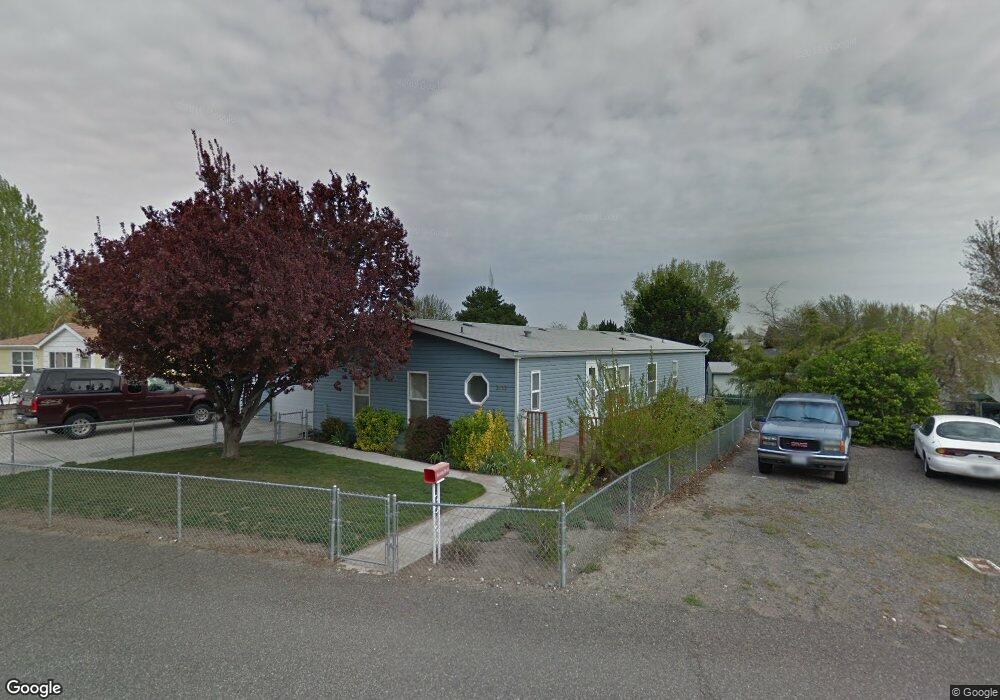
2132 N Vermont Loop Kennewick, WA 99336
Estimated Value: $316,000 - $378,224
--
Bed
--
Bath
1,960
Sq Ft
$173/Sq Ft
Est. Value
About This Home
This home is located at 2132 N Vermont Loop, Kennewick, WA 99336 and is currently estimated at $339,306, approximately $173 per square foot. 2132 N Vermont Loop is a home with nearby schools including Badger Mountain Elementary School, Carmichael Middle School, and Richland High School.
Ownership History
Date
Name
Owned For
Owner Type
Purchase Details
Closed on
Sep 15, 2023
Sold by
Heidenhain Paul V
Bought by
Heidenhain Paul V and Heidenhain Kitty J
Current Estimated Value
Home Financials for this Owner
Home Financials are based on the most recent Mortgage that was taken out on this home.
Original Mortgage
$502,500
Outstanding Balance
$374,045
Interest Rate
1.7%
Estimated Equity
-$34,739
Purchase Details
Closed on
May 23, 2006
Sold by
Nickeson Starlia K
Bought by
Heidenhain Paul
Home Financials for this Owner
Home Financials are based on the most recent Mortgage that was taken out on this home.
Original Mortgage
$103,073
Interest Rate
6.46%
Mortgage Type
FHA
Create a Home Valuation Report for This Property
The Home Valuation Report is an in-depth analysis detailing your home's value as well as a comparison with similar homes in the area
Home Values in the Area
Average Home Value in this Area
Purchase History
| Date | Buyer | Sale Price | Title Company |
|---|---|---|---|
| Heidenhain Paul V | $313 | None Listed On Document | |
| Heidenhain Paul | $104,000 | Chicago Title |
Source: Public Records
Mortgage History
| Date | Status | Borrower | Loan Amount |
|---|---|---|---|
| Open | Heidenhain Paul V | $502,500 | |
| Closed | Heidenhain Paul V | $502,500 | |
| Previous Owner | Heidenhain Paul | $103,073 |
Source: Public Records
Tax History Compared to Growth
Tax History
| Year | Tax Paid | Tax Assessment Tax Assessment Total Assessment is a certain percentage of the fair market value that is determined by local assessors to be the total taxable value of land and additions on the property. | Land | Improvement |
|---|---|---|---|---|
| 2024 | $2,509 | $308,360 | $50,000 | $258,360 |
| 2023 | $2,509 | $277,610 | $50,000 | $227,610 |
| 2022 | $2,400 | $240,700 | $50,000 | $190,700 |
| 2021 | $2,165 | $222,240 | $50,000 | $172,240 |
| 2020 | $1,616 | $191,490 | $50,000 | $141,490 |
| 2019 | $1,131 | $134,360 | $28,000 | $106,360 |
| 2018 | $1,347 | $101,350 | $28,000 | $73,350 |
| 2017 | $1,173 | $101,350 | $28,000 | $73,350 |
| 2016 | $1,167 | $101,350 | $28,000 | $73,350 |
| 2015 | $1,188 | $101,350 | $28,000 | $73,350 |
| 2014 | -- | $101,350 | $28,000 | $73,350 |
| 2013 | -- | $101,350 | $28,000 | $73,350 |
Source: Public Records
Map
Nearby Homes
- 1580 Foxglove Ave
- 9139 W Arrowhead Ave
- 2105 N Steptoe St Unit 119
- 2105 N Steptoe St Unit 50
- 2105 N Steptoe St Unit 106
- 2327 N Rhode Island St
- 510 Boros Ct
- 507 Cherokee St
- 2101 N Pittsburg Ct
- 423 Nicklaus Ct
- 506 Cherokee St
- 2467 N Rhode Island Ct
- 1934 Fairway Dr
- 8908 W Canyon Ave
- 8700 W Bonnie Ave
- 269 Gage Blvd
- 2109 N Nevada St
- 277 Gage Blvd
- 1443 Desert Springs Ave
- 8612 W Arrowhead Ave
- 2126 N Vermont Loop
- 9171 W Yellowstone Ave
- 9159 W Yellowstone Ave
- 2138 N Vermont Loop
- 9183 W Yellowstone Ave
- 9183 W Yellowstone Ave Unit Delightful and move
- 2133 N Vermont Loop
- 2133 N Vermont Loop Unit Owned Lot!
- 2120 N Vermont Loop
- 2127 N Vermont Loop
- 2150 N Vermont Loop
- 2139 N Vermont Loop
- 9153 W Yellowstone Ave
- 9153 W Yellowstone Ave Unit Verbally accepted -
- 2121 N Vermont Loop
- 2145 N Vermont Loop
- 2168 N Vermont Loop
- 2104 N Vermont Loop
- 9174 W Yellowstone Ave
- 2115 N Vermont Loop