2132 Pleasant Plains Rd Matthews, NC 28105
Estimated Value: $625,000 - $712,588
3
Beds
3
Baths
2,945
Sq Ft
$223/Sq Ft
Est. Value
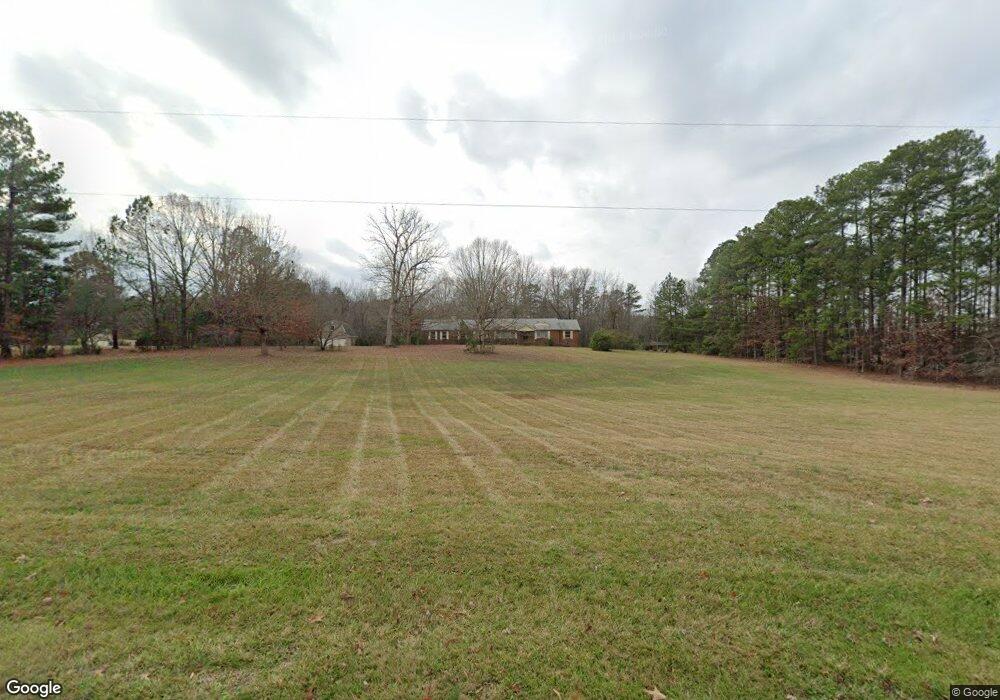
About This Home
This home is located at 2132 Pleasant Plains Rd, Matthews, NC 28105 and is currently estimated at $655,397, approximately $222 per square foot. 2132 Pleasant Plains Rd is a home located in Mecklenburg County with nearby schools including Matthews Elementary, Crestdale Middle School, and Butler High School.
Ownership History
Date
Name
Owned For
Owner Type
Purchase Details
Closed on
Aug 14, 2025
Sold by
Goodwin Homes Llc
Bought by
Gch Builders Llc
Current Estimated Value
Home Financials for this Owner
Home Financials are based on the most recent Mortgage that was taken out on this home.
Original Mortgage
$8,915,000
Outstanding Balance
$8,907,203
Interest Rate
6.67%
Mortgage Type
Credit Line Revolving
Estimated Equity
-$8,251,806
Purchase Details
Closed on
Oct 20, 2021
Sold by
Moore Kent E and Moore Family Irrevocable Trust
Bought by
Goodwin Homes Llc
Purchase Details
Closed on
Feb 11, 2014
Sold by
Moore Jack H and Moore Helen S
Bought by
Moore Kent E and Moore Family Irrevocable Trust
Purchase Details
Closed on
Jan 17, 1961
Bought by
Moore Jack Howard and Moore Helen S
Create a Home Valuation Report for This Property
The Home Valuation Report is an in-depth analysis detailing your home's value as well as a comparison with similar homes in the area
Home Values in the Area
Average Home Value in this Area
Purchase History
| Date | Buyer | Sale Price | Title Company |
|---|---|---|---|
| Gch Builders Llc | -- | None Listed On Document | |
| Goodwin Homes Llc | $500,000 | None Available | |
| Moore Kent E | -- | None Available | |
| Moore Jack Howard | -- | -- |
Source: Public Records
Mortgage History
| Date | Status | Borrower | Loan Amount |
|---|---|---|---|
| Open | Gch Builders Llc | $8,915,000 | |
| Closed | Goodwin Homes Llc | $0 |
Source: Public Records
Tax History Compared to Growth
Tax History
| Year | Tax Paid | Tax Assessment Tax Assessment Total Assessment is a certain percentage of the fair market value that is determined by local assessors to be the total taxable value of land and additions on the property. | Land | Improvement |
|---|---|---|---|---|
| 2025 | $4,543 | $599,400 | $165,000 | $434,400 |
| 2024 | $4,543 | $599,400 | $165,000 | $434,400 |
| 2023 | $4,543 | $599,400 | $165,000 | $434,400 |
| 2022 | $2,626 | $283,600 | $116,900 | $166,700 |
| 2021 | $2,626 | $283,600 | $116,900 | $166,700 |
| 2020 | $2,583 | $283,600 | $116,900 | $166,700 |
| 2019 | $2,577 | $414,800 | $292,200 | $122,600 |
| 2018 | $2,773 | $233,000 | $120,900 | $112,100 |
| 2017 | $2,717 | $233,000 | $120,900 | $112,100 |
| 2016 | $2,713 | $233,000 | $120,900 | $112,100 |
| 2015 | -- | $233,000 | $120,900 | $112,100 |
| 2014 | $2,826 | $248,100 | $136,000 | $112,100 |
Source: Public Records
Map
Nearby Homes
- 2650 Whisper Ridge Ln
- 2729 Edgebrook Cir
- 2017 Shannon Bridge Ln
- 2304 Wineberry Ct
- 1840 Thornblade Ridge Dr
- 2423 Winterbrooke Dr
- 1206 Matthews Plantation Dr
- 1401 Matthews Plantation Dr
- 2424 Honey Creek Ln
- 3318 Providence Hills Dr
- 1308 Pleasant Plains Rd
- 7403 Lamplighter Close Dr
- 1304 Pleasant Plains Rd
- 2413 Cross Country Rd
- 7229 Corduroy Ct
- 6932 Augustine Way
- 2306 Nettleton Ct
- 7325 Habitat Manor Dr
- 2825 Redfield Dr
- 4228 Wallbrook Dr
- 1700 Fair Forest Dr
- 1718 Fair Forest Dr
- 2110 Pleasant Plains Rd
- 1513 Dalwen Green Ct
- 2351 Pleasant Plains Rd
- 1800 Fair Forest Dr
- 1516 Dalwen Green Ct
- 1509 Dalwen Green Ct
- 1508 Schuster Ct
- 1509 Schuster Ct
- 1717 Fair Forest Dr
- 1504 Schuster Ct
- 1512 Dalwen Green Ct
- 2358 Fernridge Ln
- 1501 Dalwen Green Ct
- 1916 Fair Forest Dr
- 1735 Fair Forest Dr
- 2020 Pleasant Plains Rd
- 2529 Grayfox Ln
- 1505 Schuster Ct