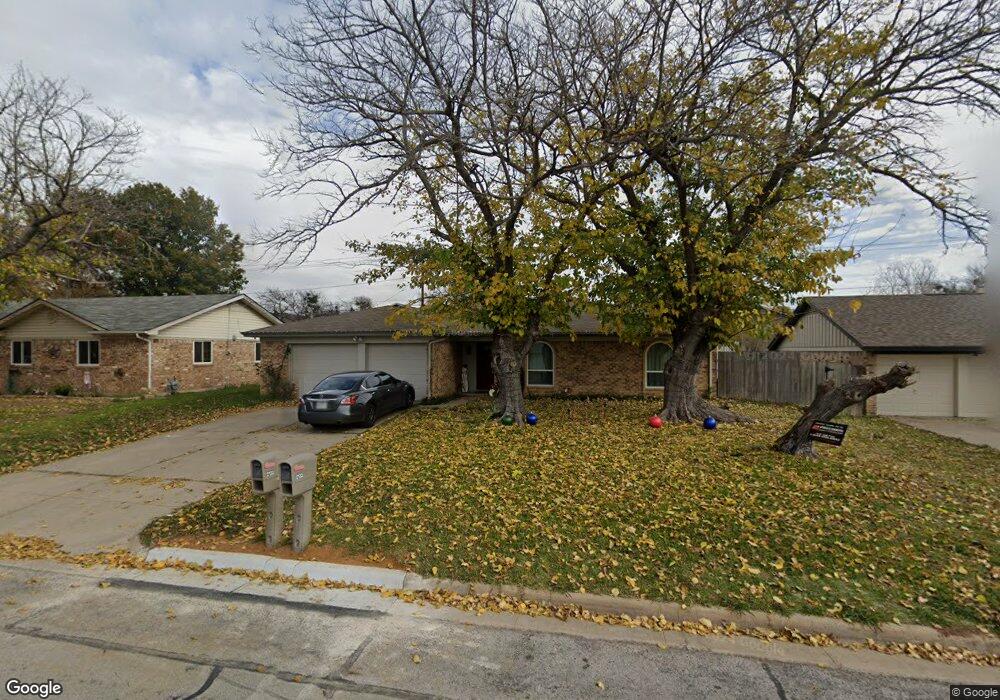
2132 Shady Grove Dr Bedford, TX 76021
Estimated Value: $322,985 - $359,000
4
Beds
3
Baths
1,578
Sq Ft
$215/Sq Ft
Est. Value
About This Home
This home is located at 2132 Shady Grove Dr, Bedford, TX 76021 and is currently estimated at $338,496, approximately $214 per square foot. 2132 Shady Grove Dr is a home located in Tarrant County with nearby schools including Shady Brook Elementary School, Bedford Junior High School, and L.D. Bell High School.
Ownership History
Date
Name
Owned For
Owner Type
Purchase Details
Closed on
Aug 24, 2018
Sold by
Welcome Home Holdings Llc
Bought by
Orelina Eugenio and Orelina Arely
Current Estimated Value
Home Financials for this Owner
Home Financials are based on the most recent Mortgage that was taken out on this home.
Original Mortgage
$214,777
Outstanding Balance
$186,525
Interest Rate
4.5%
Mortgage Type
Purchase Money Mortgage
Estimated Equity
$151,971
Purchase Details
Closed on
May 4, 2018
Sold by
Finn Michael
Bought by
Welcome Home Holdings Llc
Home Financials for this Owner
Home Financials are based on the most recent Mortgage that was taken out on this home.
Original Mortgage
$142,500
Interest Rate
4.45%
Mortgage Type
Purchase Money Mortgage
Purchase Details
Closed on
May 1, 2001
Sold by
Finn Monique
Bought by
Finn Michael
Purchase Details
Closed on
Sep 25, 1996
Sold by
Cinotto Jean Marie
Bought by
Finn Michael J and Diaz Monique A
Home Financials for this Owner
Home Financials are based on the most recent Mortgage that was taken out on this home.
Original Mortgage
$83,947
Interest Rate
7.91%
Mortgage Type
FHA
Create a Home Valuation Report for This Property
The Home Valuation Report is an in-depth analysis detailing your home's value as well as a comparison with similar homes in the area
Home Values in the Area
Average Home Value in this Area
Purchase History
| Date | Buyer | Sale Price | Title Company |
|---|---|---|---|
| Orelina Eugenio | -- | Providence Title Co | |
| Welcome Home Holdings Llc | -- | Providence Title Co | |
| Finn Michael | -- | -- | |
| Finn Michael J | -- | Stewart Title |
Source: Public Records
Mortgage History
| Date | Status | Borrower | Loan Amount |
|---|---|---|---|
| Open | Orelina Eugenio | $214,777 | |
| Previous Owner | Welcome Home Holdings Llc | $142,500 | |
| Previous Owner | Finn Michael J | $83,947 | |
| Closed | Finn Michael | $0 |
Source: Public Records
Tax History Compared to Growth
Tax History
| Year | Tax Paid | Tax Assessment Tax Assessment Total Assessment is a certain percentage of the fair market value that is determined by local assessors to be the total taxable value of land and additions on the property. | Land | Improvement |
|---|---|---|---|---|
| 2025 | $4,275 | $289,481 | $65,000 | $224,481 |
| 2024 | $4,275 | $289,481 | $65,000 | $224,481 |
| 2023 | $4,932 | $298,143 | $40,000 | $258,143 |
| 2022 | $5,106 | $243,439 | $40,000 | $203,439 |
| 2021 | $5,006 | $235,747 | $40,000 | $195,747 |
| 2020 | $4,594 | $193,199 | $40,000 | $153,199 |
| 2019 | $4,493 | $184,937 | $40,000 | $144,937 |
| 2018 | $3,092 | $143,000 | $40,000 | $103,000 |
| 2017 | $3,145 | $130,000 | $25,000 | $105,000 |
| 2016 | $3,249 | $143,911 | $25,000 | $118,911 |
| 2015 | $2,791 | $122,100 | $17,000 | $105,100 |
| 2014 | $2,791 | $122,100 | $17,000 | $105,100 |
Source: Public Records
Map
Nearby Homes
- 2116 Tamworth Ct
- 2225 Shady Brook Dr
- 18 Park Ln
- 6 Park Ln
- 49 Morrow Dr
- 31 Morrow Dr
- 2317 Shady Grove Dr
- 2420 Stonegate Dr N
- 345 Somerset Cir
- 258 Somerset Terrace
- 2501 Shady Grove Dr
- 140 Stonegate Ct
- 93 Regents Park
- 2508 Lakeview Dr
- 2436 Brookgreen Ct
- 2503 Shady Ridge Dr
- 2524 Shady Ridge Dr
- 1740 Brown Trail
- 817 Shady Lake Dr
- 1601 Warwickshire Ct W
- 2136 Shady Grove Dr
- 2128 Shady Grove Dr
- 2140 Shady Grove Dr
- 2124 Shady Grove Dr
- 2129 Shady Grove Dr
- 2133 Shady Grove Dr
- 2125 Shady Grove Dr
- 2137 Shady Grove Dr
- 2120 Shady Grove Dr
- 2144 Shady Grove Dr
- 1948 Shady Brook Dr
- 2121 Shady Grove Dr
- 2141 Shady Grove Dr
- 2124 Shady Brook Dr
- 1204 Tranquilla Terrace
- 2120 Shady Brook Dr
- 2117 Shady Grove Dr
- 2116 Shady Grove Dr
- 2148 Shady Grove Dr
- 2128 Shady Brook Dr