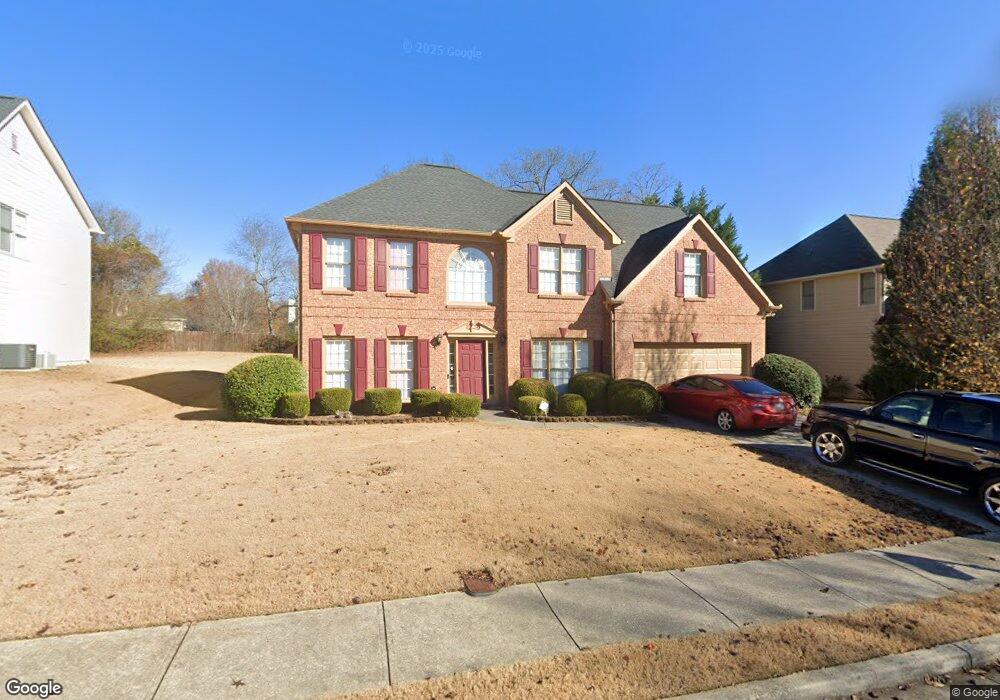
2132 Shin Ct Buford, GA 30519
Estimated Value: $435,000 - $467,000
3
Beds
2
Baths
2,935
Sq Ft
$152/Sq Ft
Est. Value
About This Home
This home is located at 2132 Shin Ct, Buford, GA 30519 and is currently estimated at $446,997, approximately $152 per square foot. 2132 Shin Ct is a home located in Gwinnett County with nearby schools including Freeman's Mill Elementary School, Twin Rivers Middle School, and Mountain View High School.
Ownership History
Date
Name
Owned For
Owner Type
Purchase Details
Closed on
Feb 13, 2004
Sold by
Togiai Jerry and Togiai Jennifer R
Bought by
Davis William A
Current Estimated Value
Home Financials for this Owner
Home Financials are based on the most recent Mortgage that was taken out on this home.
Original Mortgage
$205,842
Outstanding Balance
$95,317
Interest Rate
5.87%
Mortgage Type
VA
Estimated Equity
$351,680
Purchase Details
Closed on
Nov 19, 2002
Sold by
Martin Ronald D
Bought by
Togiai Jerry and Togiai Jennifer R
Home Financials for this Owner
Home Financials are based on the most recent Mortgage that was taken out on this home.
Original Mortgage
$181,150
Interest Rate
3.63%
Mortgage Type
New Conventional
Purchase Details
Closed on
May 24, 2002
Sold by
Rising Homes Inc
Bought by
Martin Ronald D
Home Financials for this Owner
Home Financials are based on the most recent Mortgage that was taken out on this home.
Original Mortgage
$148,000
Interest Rate
6.92%
Mortgage Type
New Conventional
Create a Home Valuation Report for This Property
The Home Valuation Report is an in-depth analysis detailing your home's value as well as a comparison with similar homes in the area
Home Values in the Area
Average Home Value in this Area
Purchase History
We collect this data history from publicly available records. To have your information removed, we recommend requesting removal directly through your county’s website.
| Date | Buyer | Sale Price | Title Company |
|---|---|---|---|
| Davis William A | $209,100 | -- | |
| Togiai Jerry | $194,900 | -- | |
| Martin Ronald D | $185,000 | -- |
Source: Public Records
Mortgage History
We collect this data history from publicly available records. To have your information removed, we recommend requesting removal directly through your county’s website.
| Date | Status | Borrower | Loan Amount |
|---|---|---|---|
| Open | Davis William A | $205,842 | |
| Previous Owner | Togiai Jerry | $181,150 | |
| Previous Owner | Martin Ronald D | $148,000 |
Source: Public Records
Tax History
| Year | Tax Paid | Tax Assessment Tax Assessment Total Assessment is a certain percentage of the fair market value that is determined by local assessors to be the total taxable value of land and additions on the property. | Land | Improvement |
|---|---|---|---|---|
| 2025 | $6,812 | $183,600 | $26,000 | $157,600 |
| 2024 | $6,781 | $180,720 | $34,000 | $146,720 |
| 2023 | $6,781 | $180,720 | $34,000 | $146,720 |
| 2022 | $5,751 | $152,560 | $26,000 | $126,560 |
| 2021 | $4,478 | $114,920 | $20,000 | $94,920 |
| 2020 | $4,504 | $114,920 | $20,000 | $94,920 |
| 2019 | $4,093 | $107,920 | $20,000 | $87,920 |
| 2018 | $4,098 | $107,920 | $20,000 | $87,920 |
| 2016 | $3,468 | $89,480 | $16,000 | $73,480 |
| 2015 | $2,692 | $66,560 | $12,000 | $54,560 |
| 2014 | -- | $66,560 | $12,000 | $54,560 |
Source: Public Records
Map
Nearby Homes
- 2486 Hampton Park Dr
- 1815 Ashton Brooke Ln
- 1805 Ashton Brooke Ln
- 1720 Fort Daniels Trail
- 1724 Willoughby Dr
- 2305 Braselton Hwy
- 1834 Willoughby Dr
- 2152 Paces Vale Place
- 2297 Roberts View Trail
- 1958 Mapmaker Dr
- 2504 Braselton Hwy
- 3483 Pearl Ridge Way
- 1692 Paces Vale Ct
- 2724 Amber Springs Way
- 1515 Brisbane Dr
- 2587 Bear Paw Dr
- 1838 Mapmaker Dr
- 2253 Old Peachtree Rd NE
- 1968 Lakeview Bend Way
- 2375 Matlin Way
- 2142 Shin Ct
- 2122 Shin Ct Unit II
- 2300 Hampton Park Ct
- 2152 Shin Ct
- 2152 Shin Ct NE
- 2112 Shin Ct Unit 2
- 2139 Shin Ct
- 2129 Shin Ct
- 2305 Hampton Park Ct
- 2149 Shin Ct
- 2310 Hampton Park Ct Unit 1
- 2102 Shin Ct NE
- 2119 Shin Ct
- 2102 Shin Ct
- 2162 Shin Ct
- 2543 Hampton Park Dr
- 2109 Shin Ct Unit 2
- 2335 Hampton Park Ct
- 2320 Hampton Park Ct
- 2169 Shin Ct NE
Your Personal Tour Guide
Ask me questions while you tour the home.