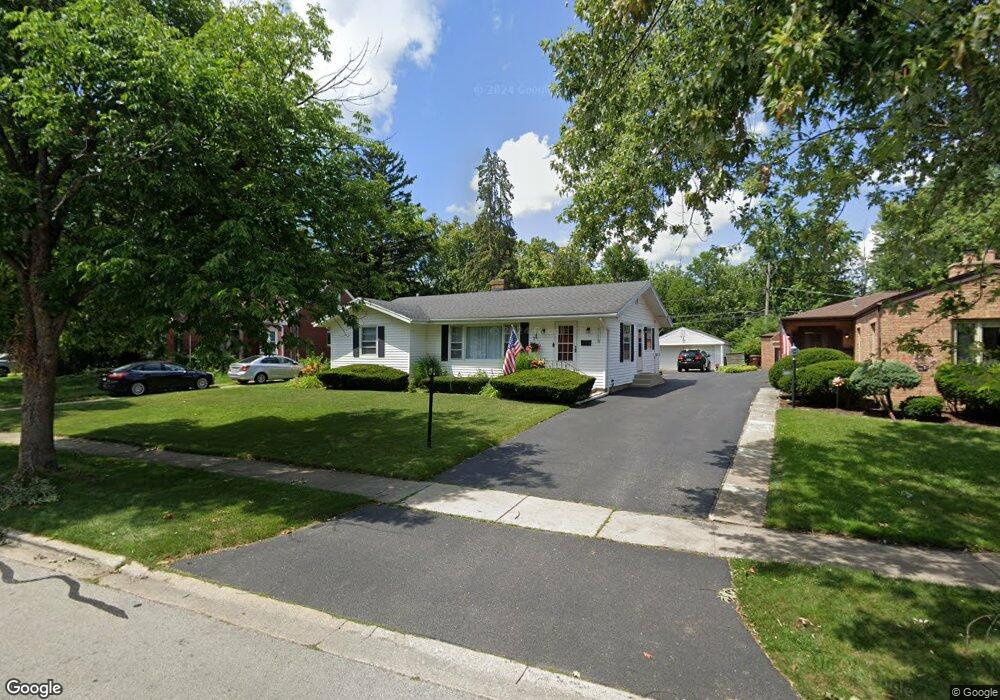
2133 Collett Ln Flossmoor, IL 60422
Estimated Value: $242,024 - $306,000
3
Beds
2
Baths
1,352
Sq Ft
$198/Sq Ft
Est. Value
About This Home
This home is located at 2133 Collett Ln, Flossmoor, IL 60422 and is currently estimated at $268,256, approximately $198 per square foot. 2133 Collett Ln is a home located in Cook County with nearby schools including Western Avenue Elementary School, Parker Junior High School, and Homewood-Flossmoor High School.
Ownership History
Date
Name
Owned For
Owner Type
Purchase Details
Closed on
Jun 23, 2009
Sold by
Devereaux John C and Devereaux Laverne M
Bought by
Ladner Edward D and Ladner Trisha A
Current Estimated Value
Home Financials for this Owner
Home Financials are based on the most recent Mortgage that was taken out on this home.
Original Mortgage
$162,011
Outstanding Balance
$101,533
Interest Rate
4.86%
Mortgage Type
FHA
Estimated Equity
$166,723
Purchase Details
Closed on
Jun 19, 2009
Sold by
Kozlowski Jean C and Devereaux Laverne M
Bought by
Ladner Edward D and Ladner Trisha A
Home Financials for this Owner
Home Financials are based on the most recent Mortgage that was taken out on this home.
Original Mortgage
$162,011
Outstanding Balance
$101,533
Interest Rate
4.86%
Mortgage Type
FHA
Estimated Equity
$166,723
Create a Home Valuation Report for This Property
The Home Valuation Report is an in-depth analysis detailing your home's value as well as a comparison with similar homes in the area
Home Values in the Area
Average Home Value in this Area
Purchase History
| Date | Buyer | Sale Price | Title Company |
|---|---|---|---|
| Ladner Edward D | -- | Ticor | |
| Ladner Edward D | -- | Ticor | |
| Ladner Edward D | $165,000 | Ticor |
Source: Public Records
Mortgage History
| Date | Status | Borrower | Loan Amount |
|---|---|---|---|
| Open | Ladner Edward D | $162,011 |
Source: Public Records
Tax History
| Year | Tax Paid | Tax Assessment Tax Assessment Total Assessment is a certain percentage of the fair market value that is determined by local assessors to be the total taxable value of land and additions on the property. | Land | Improvement |
|---|---|---|---|---|
| 2025 | $7,957 | $22,000 | $5,430 | $16,570 |
| 2024 | $7,957 | $22,000 | $5,430 | $16,570 |
| 2023 | $5,069 | $22,000 | $5,430 | $16,570 |
| 2022 | $5,069 | $12,854 | $4,616 | $8,238 |
| 2021 | $5,117 | $12,853 | $4,615 | $8,238 |
| 2020 | $5,021 | $12,853 | $4,615 | $8,238 |
| 2019 | $7,099 | $16,645 | $4,072 | $12,573 |
| 2018 | $6,826 | $16,645 | $4,072 | $12,573 |
| 2017 | $6,734 | $16,645 | $4,072 | $12,573 |
| 2016 | $6,353 | $14,535 | $3,801 | $10,734 |
| 2015 | $6,316 | $14,535 | $3,801 | $10,734 |
| 2014 | $6,222 | $14,535 | $3,801 | $10,734 |
| 2013 | $6,156 | $15,582 | $3,801 | $11,781 |
Source: Public Records
Map
Nearby Homes
- 18646 Palmer Cir
- 2045 Downey Rd
- 2303 Hutchison Rd
- 18547 Lexington Ave
- 18537 Palmer Ave
- 712 Gardner Rd
- 2318 Vardon Ln
- 18462 Dixie Hwy
- 1834 Terrace Rd
- 808 Sterling Ave
- 2311 Clyde Terrace
- 2323 Clyde Terrace
- 18630 Highland Ave
- 18404 Dixie Hwy
- 18419 Gottschalk Ave
- 2301 183rd St Unit 401
- 2055 183rd St
- 1710 187th St
- 18511 Argyle Ave
- 1923 183rd St
- 2135 Collett Ln
- 2141 Collett Ln
- 2121 Collett Ln
- 2131 Downey Rd
- 2137 Downey Rd
- 2127 Downey Rd
- 2117 Collett Ln
- 2141 Downey Rd
- 2121 Downey Rd
- 2128 Collett Ln
- 2134 Collett Ln
- 2145 Collett Ln
- 2117 Downey Rd
- 2120 Collett Ln
- 2145 Downey Rd
- 2111 Collett Ln
- 2111 Downey Rd
- 2116 Collett Ln
- 2149 Downey Rd
- 2107 Collett Ln
Your Personal Tour Guide
Ask me questions while you tour the home.