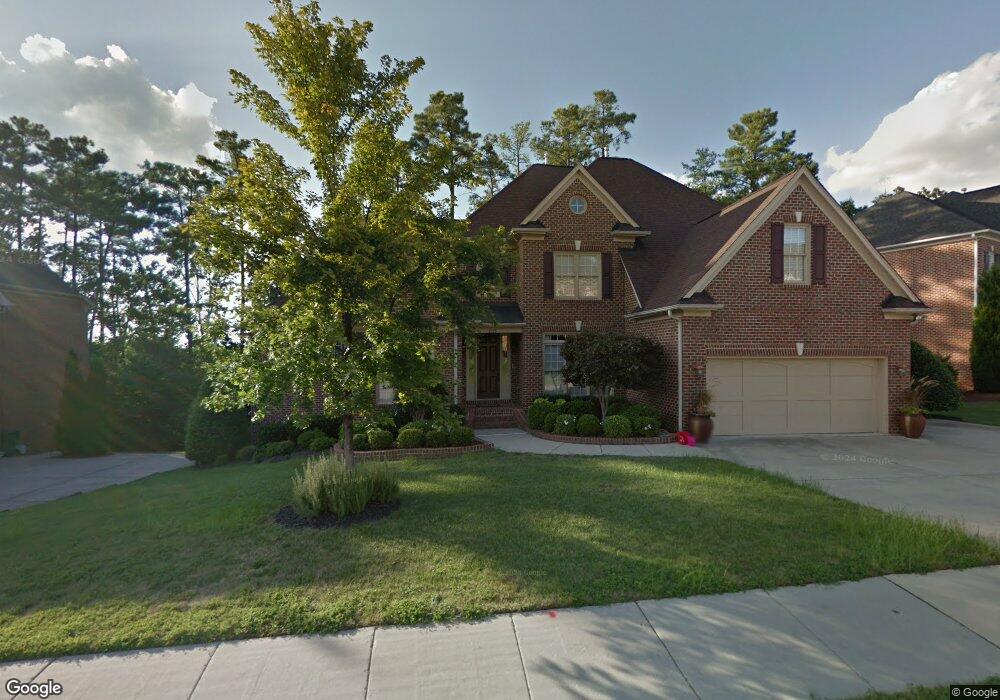
2133 Crigan Bluff Dr Cary, NC 27513
West Cary NeighborhoodEstimated Value: $1,403,000 - $1,731,000
6
Beds
6
Baths
6,276
Sq Ft
$241/Sq Ft
Est. Value
About This Home
This home is located at 2133 Crigan Bluff Dr, Cary, NC 27513 and is currently estimated at $1,510,521, approximately $240 per square foot. 2133 Crigan Bluff Dr is a home located in Wake County with nearby schools including Weatherstone Elementary School, West Cary Middle School, and Green Hope High.
Ownership History
Date
Name
Owned For
Owner Type
Purchase Details
Closed on
Aug 14, 2014
Sold by
Lenoir James E and Lenoir Marian A
Bought by
Crawford Larry L and Crawford Constance L
Current Estimated Value
Home Financials for this Owner
Home Financials are based on the most recent Mortgage that was taken out on this home.
Original Mortgage
$400,000
Outstanding Balance
$124,252
Interest Rate
3.31%
Mortgage Type
New Conventional
Estimated Equity
$1,386,269
Purchase Details
Closed on
Aug 19, 2005
Sold by
John Wieland Homes & Neighborhoods Of Th
Bought by
Lenoir James E and Lenoir Marian A
Home Financials for this Owner
Home Financials are based on the most recent Mortgage that was taken out on this home.
Original Mortgage
$133,000
Interest Rate
5.25%
Mortgage Type
Stand Alone Second
Create a Home Valuation Report for This Property
The Home Valuation Report is an in-depth analysis detailing your home's value as well as a comparison with similar homes in the area
Home Values in the Area
Average Home Value in this Area
Purchase History
| Date | Buyer | Sale Price | Title Company |
|---|---|---|---|
| Crawford Larry L | $835,000 | None Available | |
| Lenoir James E | $665,500 | None Available |
Source: Public Records
Mortgage History
| Date | Status | Borrower | Loan Amount |
|---|---|---|---|
| Open | Crawford Larry L | $400,000 | |
| Previous Owner | Lenoir James E | $133,000 | |
| Previous Owner | Lenoir James E | $532,050 |
Source: Public Records
Tax History
| Year | Tax Paid | Tax Assessment Tax Assessment Total Assessment is a certain percentage of the fair market value that is determined by local assessors to be the total taxable value of land and additions on the property. | Land | Improvement |
|---|---|---|---|---|
| 2025 | $11,408 | $1,328,683 | $300,000 | $1,028,683 |
| 2024 | $11,161 | $1,328,683 | $300,000 | $1,028,683 |
Source: Public Records
Map
Nearby Homes
- 768 Ballyneal Aly
- 766 Ballyneal Aly
- 770 Ballyneal Aly
- 786 Ballyneal Aly
- 772 Ballyneal Aly
- 780 Ballyneal Aly
- 778 Ballyneal Aly
- 774 Ballyneal Aly
- 776 Ballyneal Aly
- 788 Ballyneal Aly
- 784 Ballyneal Aly
- 607 Weather Ridge Ln Unit 24
- 611 Weather Ridge Ln Unit 25
- 618 Weather Ridge Ln Unit 28
- 621 Weather Ridge Ln Unit 33
- 602 Weather Ridge Ln Unit 21
- 522 Weather Ridge Ln
- 512 Weather Ridge Ln Unit 2
- 101 Pember Place
- 102 Trellingwood Dr
- 2131 Crigan Bluff Dr
- 2135 Crigan Bluff Dr
- 1001 Oldham Forest Crossing
- 2126 Crigan Bluff Dr
- 2129 Crigan Bluff Dr
- 2128 Crigan Bluff Dr
- 1000 Oldham Forest Crossing
- 2130 Crigan Bluff Dr
- 2127 Crigan Bluff Dr
- 1002 Oldham Forest Crossing
- 2136 Crigan Bluff Dr
- 2001 Killearn Mill Ct
- 2122 Crigan Bluff Dr
- 2132 Crigan Bluff Dr
- 2003 Killearn Mill Ct
- 1003 Oldham Forest Crossing
- 2134 Crigan Bluff Dr
- 2005 Killearn Mill Ct
- 2125 Crigan Bluff Dr
- 2007 Killearn Mill Ct
Your Personal Tour Guide
Ask me questions while you tour the home.