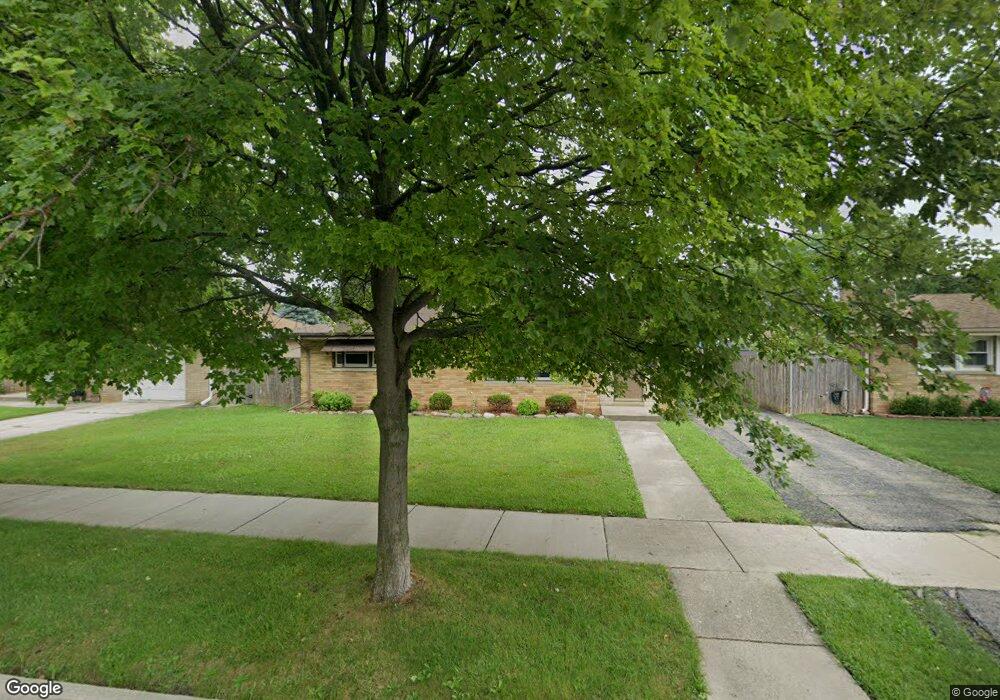
2133 N Jackson St Waukegan, IL 60087
Marquette Highlands NeighborhoodEstimated Value: $248,000 - $255,021
3
Beds
2
Baths
1,161
Sq Ft
$216/Sq Ft
Est. Value
About This Home
This home is located at 2133 N Jackson St, Waukegan, IL 60087 and is currently estimated at $251,255, approximately $216 per square foot. 2133 N Jackson St is a home located in Lake County with nearby schools including John S. Clark Elementary School, Jack Benny Middle School, and Waukegan High School.
Ownership History
Date
Name
Owned For
Owner Type
Purchase Details
Closed on
Aug 28, 2018
Sold by
Calcari Brett N and The Brett N Calcari Trust
Bought by
Livi Calcari Brett N and Livi Brett N Calcari Revocable
Current Estimated Value
Purchase Details
Closed on
Nov 8, 2007
Sold by
Calcari Brett N
Bought by
Calcari Brett N and Brett N Calcari Trust
Purchase Details
Closed on
Jan 16, 2001
Sold by
Calcari Terri L
Bought by
Calcari Brett N
Create a Home Valuation Report for This Property
The Home Valuation Report is an in-depth analysis detailing your home's value as well as a comparison with similar homes in the area
Home Values in the Area
Average Home Value in this Area
Purchase History
| Date | Buyer | Sale Price | Title Company |
|---|---|---|---|
| Livi Calcari Brett N | -- | Attorney | |
| Calcari Brett N | -- | None Available | |
| Calcari Brett N | -- | Chicago Title Insurance Co |
Source: Public Records
Tax History Compared to Growth
Tax History
| Year | Tax Paid | Tax Assessment Tax Assessment Total Assessment is a certain percentage of the fair market value that is determined by local assessors to be the total taxable value of land and additions on the property. | Land | Improvement |
|---|---|---|---|---|
| 2024 | $5,810 | $68,279 | $12,558 | $55,721 |
| 2023 | $5,461 | $61,612 | $11,332 | $50,280 |
| 2022 | $5,461 | $55,864 | $9,809 | $46,055 |
| 2021 | $5,226 | $50,122 | $8,749 | $41,373 |
| 2020 | $5,293 | $46,695 | $8,151 | $38,544 |
| 2019 | $5,327 | $42,788 | $7,469 | $35,319 |
| 2018 | $4,164 | $38,586 | $10,572 | $28,014 |
| 2017 | $4,003 | $34,138 | $9,353 | $24,785 |
| 2016 | $3,657 | $29,664 | $8,127 | $21,537 |
| 2015 | $3,471 | $26,550 | $7,274 | $19,276 |
| 2014 | $3,418 | $25,741 | $7,284 | $18,457 |
| 2012 | $4,456 | $27,887 | $7,891 | $19,996 |
Source: Public Records
Map
Nearby Homes
- 2232 Walnut St
- 1905 Linden Ave
- 616 W Keith Ave
- 301 W Eagle Ct
- 1018 W Atlantic Ave
- 0 Traditions Dr
- 2246 Alta Vista Dr
- 2213 Alta Vista Dr
- 1336 N Ash St
- 1335 Chestnut St
- 2350 N Lewis Ave
- 1312 N Linden Ave
- 1612 Whitney St
- 2613 N Lewis Ave
- 1504 W Glen Flora Ave
- 1105 Woodlawn Cir
- 1110 N Ash St
- 2008 Harding Ave
- 2207 Williamsburg Dr
- 2009 Harding Ave
- 2141 N Jackson St
- 2129 N Jackson St
- 2132 Chestnut St
- 823 Sunset Terrace
- 2125 N Jackson St
- 2124 Chestnut St
- 819 Sunset Terrace
- 2132 N Jackson St
- 2121 N Jackson St
- 2136 N Jackson St
- 2128 N Jackson St
- 2118 Chestnut St
- 901 Sunset Terrace
- 2124 N Jackson St
- 2201 N Jackson St
- 2113 N Jackson St
- 2120 N Jackson St
- 2202 Chestnut St
- 900 Sunset Terrace
- 2109 N Jackson St