2133 San Fernando St Bedford, TX 76021
Estimated Value: $283,524 - $327,000
3
Beds
2
Baths
1,388
Sq Ft
$225/Sq Ft
Est. Value
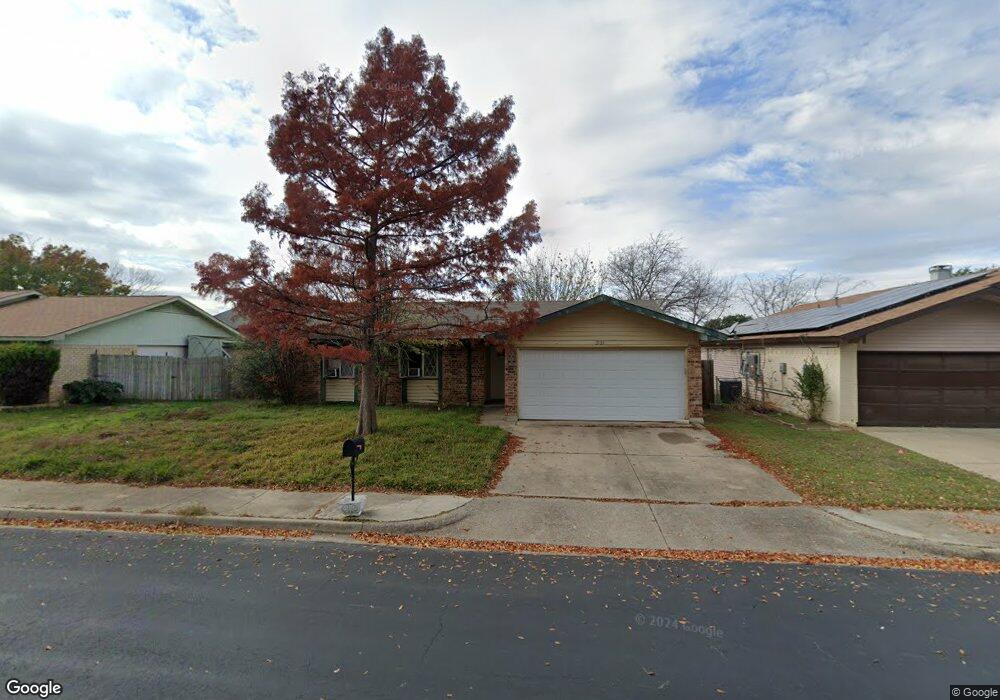
About This Home
This home is located at 2133 San Fernando St, Bedford, TX 76021 and is currently estimated at $312,131, approximately $224 per square foot. 2133 San Fernando St is a home located in Tarrant County with nearby schools including Shady Brook Elementary School, Bedford Junior High School, and L.D. Bell High School.
Ownership History
Date
Name
Owned For
Owner Type
Purchase Details
Closed on
Dec 3, 2013
Sold by
Bryant Julie C
Bought by
Pensco Trust Company Llc
Current Estimated Value
Home Financials for this Owner
Home Financials are based on the most recent Mortgage that was taken out on this home.
Original Mortgage
$73,000
Outstanding Balance
$37,710
Interest Rate
4.26%
Mortgage Type
New Conventional
Estimated Equity
$274,421
Purchase Details
Closed on
Nov 25, 1998
Sold by
Wright G Dean and Wright Lori Everett
Bought by
Ijames Paul and Ijames Gina
Home Financials for this Owner
Home Financials are based on the most recent Mortgage that was taken out on this home.
Original Mortgage
$67,650
Interest Rate
9.85%
Create a Home Valuation Report for This Property
The Home Valuation Report is an in-depth analysis detailing your home's value as well as a comparison with similar homes in the area
Home Values in the Area
Average Home Value in this Area
Purchase History
| Date | Buyer | Sale Price | Title Company |
|---|---|---|---|
| Pensco Trust Company Llc | -- | Fatco | |
| Ijames Paul | -- | Safeco Land Title Co |
Source: Public Records
Mortgage History
| Date | Status | Borrower | Loan Amount |
|---|---|---|---|
| Open | Pensco Trust Company Llc | $73,000 | |
| Previous Owner | Ijames Paul | $67,650 |
Source: Public Records
Tax History Compared to Growth
Tax History
| Year | Tax Paid | Tax Assessment Tax Assessment Total Assessment is a certain percentage of the fair market value that is determined by local assessors to be the total taxable value of land and additions on the property. | Land | Improvement |
|---|---|---|---|---|
| 2025 | $4,803 | $246,705 | $40,000 | $206,705 |
| 2024 | $4,803 | $246,705 | $40,000 | $206,705 |
| 2023 | $4,511 | $235,195 | $40,000 | $195,195 |
| 2022 | $4,947 | $226,506 | $40,000 | $186,506 |
| 2021 | $5,373 | $228,086 | $40,000 | $188,086 |
| 2020 | $5,136 | $216,034 | $40,000 | $176,034 |
| 2019 | $4,950 | $203,756 | $40,000 | $163,756 |
| 2018 | $4,318 | $177,749 | $40,000 | $137,749 |
| 2017 | $3,682 | $152,183 | $25,000 | $127,183 |
| 2016 | $3,456 | $142,870 | $25,000 | $117,870 |
| 2015 | $2,659 | $105,900 | $14,000 | $91,900 |
| 2014 | $2,659 | $105,900 | $14,000 | $91,900 |
Source: Public Records
Map
Nearby Homes
- 18 Park Ln
- 6 Park Ln
- 49 Morrow Dr
- 31 Morrow Dr
- 2225 Shady Brook Dr
- 2116 Tamworth Ct
- 2317 Shady Grove Dr
- 2503 Shady Ridge Dr
- 2524 Shady Ridge Dr
- 2501 Shady Grove Dr
- 2420 Stonegate Dr N
- 1601 Warwickshire Ct W
- 2508 Lakeview Dr
- 345 Somerset Cir
- 258 Somerset Terrace
- 140 Stonegate Ct
- 2436 Brookgreen Ct
- 93 Regents Park
- 2700 Shady Grove Dr
- 2704 Shady Grove Dr
- 2129 San Fernando St
- 2137 San Fernando St
- 2125 San Fernando St
- 2132 San Fernando St
- 2136 San Fernando St
- 1216 Tranquilla Terrace
- 2128 San Fernando St
- 2140 San Fernando St
- 2121 San Fernando St
- 2141 San Fernando St
- 2124 San Fernando St
- 2144 San Fernando St
- 2132 Redondo Rd
- 1212 Tranquilla Terrace
- 2117 Loma Verde Dr
- 2121 Loma Verde Dr
- 2113 Loma Verde Dr
- 2120 San Fernando St
- 2125 Loma Verde Dr
- 2117 San Fernando St